1957 - United Nations Statistics Division
1957 - United Nations Statistics Division
1957 - United Nations Statistics Division
Create successful ePaper yourself
Turn your PDF publications into a flip-book with our unique Google optimized e-Paper software.
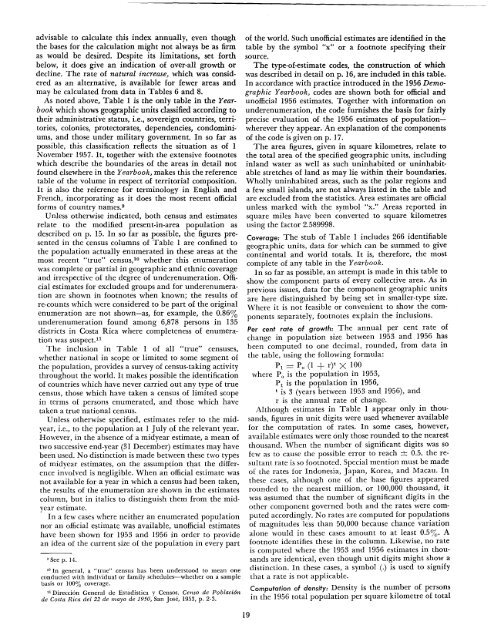
advisable to calculate this index annually, even though<br />
the bases for the calculation might not always be as firm<br />
as would be desired. Despite its limitations, set forth<br />
below, it does give an indication of over-all growth or<br />
decline. The rate of natural increase, which was considered<br />
as an alternative, is available for fewer areas and<br />
may be calculated from data in Tables 6 and 8.<br />
As noted above, Table I is the only table in the Yearbook<br />
which shows geographic units classified according to<br />
their administrative status, i.e., sovereign countries, territories,<br />
colonies, protectorates, dependencies, condominiums,<br />
and those under military government. In so far as<br />
possible, this classification reflects the situation as of I<br />
November <strong>1957</strong>. It, together with the extensive footnotes<br />
which describe the boundaries of the areas in detail not<br />
found elsewhere in the Yearbook, makes this the reference<br />
table of the volume in respect of territorial composition.<br />
It is also the reference for terminology in English and<br />
French, incorporating as it does the most recent official<br />
forms of country names. 9<br />
Unless otherwise indicated, both census and estimates<br />
relate to the modified present-in-area population as<br />
described on p. 15. In so far as possible, the figures presented<br />
in the census columns of Table 1 are confined to<br />
the population actually enumerated in these areas at the<br />
most recent "true" census,lO whether this enumeration<br />
was complete or partial in geographic and ethnic coverage<br />
and irrespective of the degree of underenumeration. Official<br />
estimates for excluded groups and for underenumeration<br />
are shown in footnotes when known; the results of<br />
re-counts which were considered to be part of the original<br />
enumeration are not shown-as, for example, the 0.86%<br />
underenumeration found among 6,878 persons in 135<br />
districts in Costa Rica where completeness of enumeration<br />
was suspect. ll<br />
The inclusion in Table I of all "true" censuses,<br />
whether national in scope or limited to some segment of<br />
the population, provides a survey of census-taking activity<br />
throughout the world. It makes possible the identification<br />
of countries which have never carried out any type of true<br />
census, those which have taken a census of limited scope<br />
in terms of persons enumerated, and those which have<br />
taken a true national census.<br />
Unless otherwise specified, estimates refer to the midyear,<br />
i.e., to the population at 1 July of the relevant year.<br />
However, in the absence of a midyear estimate, a mean of<br />
two successive end-year (31 December) estimates may have<br />
been used. No distinction is made between these two types<br />
of midyear estimates, on the assumption that the difference<br />
involved is negligible. When an official estimate was<br />
not available for a year in which a census had been taken,<br />
the results of the enumeration are shown in the estimates<br />
column, but in italics to distinguish them from the midyear<br />
estimate.<br />
In a few cases where neither an enumerated population<br />
nor an official estimate was available, unofficial estimates<br />
have been shown for 1953 and 1956 in order to provide<br />
an idea of the current size of the population in every part<br />
9 See p. 14.<br />
10 In general, a "true" census has been understood to mean one<br />
conducted with individual or family schedules-whether on a sample<br />
basis or 100% coverage.<br />
11 Direcci6n General de Estadistica y Censos. Censo de Poblaci6n<br />
de Costa Rica del 22 de mayo de 1950, San Jose, 1953, p. 2-3.<br />
of the world. Such unofficial estimates are identified in the<br />
table by the symbol "x" or a footnote specifying their<br />
source.<br />
The type-of-estimate codes, the construction of which<br />
was described in detail on p. 16, are induded in this table.<br />
In accordance with practice introduced in the 1956 Demographic<br />
Yearbook, codes are shown both for official and<br />
unofficial 1956 estimates. Together with information on<br />
underenumeration, the code furnishes the basis for fairly<br />
precise evaluation of the 1956 estimates of populationwherever<br />
they appear. An explanation of the components<br />
of the code is given on p. 17.<br />
The area figures, given in square kilometres, relate to<br />
the total area of the specified geographic units, including<br />
inland water as well as such uninhabited or uninhabitable<br />
stretches of land as may lie within their boundaries.<br />
Wholly uninhabited areas, such as the polar regions and<br />
a few small islands, are not always listed in the table and<br />
are excluded from the statistics. Area estimates are official<br />
unless marked with the symbol "x." Areas reported in<br />
square miles have been converted to square kilometres<br />
using the factor 2.589998.<br />
Coverage: The stub of Table 1 includes 266 identifiable<br />
geographic units, data for which can be summed to give<br />
continental and world totals. It is, therefore, the most<br />
complete of any table in the Yearbook.<br />
In so far as possible, an attempt is made in this table to<br />
show the component parts of every collective area. As in<br />
previous issues, data for the component geographic units<br />
are here distinguished by being set in smaller-type size.<br />
Where it is not feasible or convenient to show the components<br />
separately. footnotes explain the inclusions.<br />
Per cent rate of growth: The annual per cent rate of<br />
change in population size between 1953 and 1956 has<br />
been computed to one decimal, rounded, from data in<br />
the table, using the following formula:<br />
P l = Po (1 + r)t X 100<br />
where Po is the population in 1953,<br />
P l is the population in 1956,<br />
t is 3 (years between 1953 and 1956), and<br />
r is the annual rate of change.<br />
Although estimates in Table 1 appear only in thousands,<br />
figures in unit digits were used whenever available<br />
for the computation of rates. In some cases, however,<br />
available estimates were only those rounded to the nearest<br />
thousand. When the number of significant digits was so<br />
few as to cause the possible error to reach -t- 0.5, the resultant<br />
rate is so footnoted. Special mention must be made<br />
of the rates for Indonesia, Japan, Korea, and Macau. In<br />
these cases, although one of the base figures appeared<br />
rounded to the nearest million, or 100,000 thousand, it<br />
was assumed that the number of significant digits in the<br />
other component governed both and the rates were computed<br />
accordingly. No rates are computed for populations<br />
of magnitudes less than 50,000 because chance variation<br />
alone would in these cases amount to at least 0.5%. A<br />
footnote identifies these in the column. Likewise, no rate<br />
is computed where the 1953 and 1956 estimates in thousands<br />
are identical, even though unit digits might show a<br />
distinction. In these cases, a symbol (.) is used to signify<br />
that a rate is not applicable.<br />
19<br />
Computation of density: Density is the number of persons<br />
in the 1956 total population per square kilometre of total


