

1957 - United Nations Statistics Division
1957 - United Nations Statistics Division
1957 - United Nations Statistics Division

You also want an ePaper? Increase the reach of your titles
YUMPU automatically turns print PDFs into web optimized ePapers that Google loves.
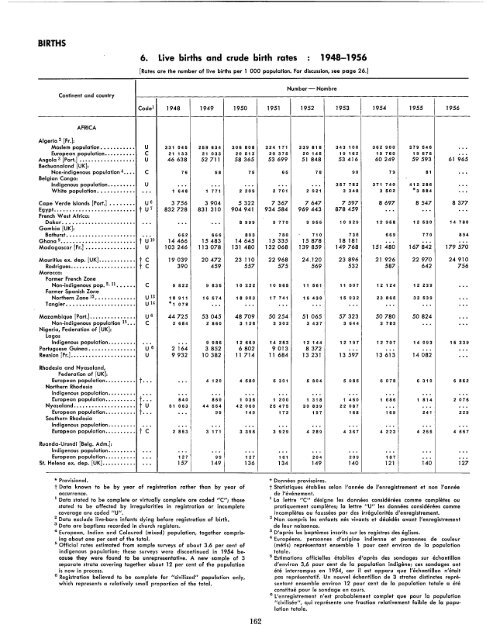
BIRTHS<br />
Continent and country<br />
AFRICA<br />
6. Live births and crude birth rates 1948-1956<br />
[Rates are the number of live births per 1 000 population. For discussion, see page 26.]<br />
Number - Nombre<br />
Code l 1948 1949 1950 1951 1952 1953 1954 1955 1956<br />
Algeria 2 [Fr.]:<br />
Moslem population, , , • , , ••••• U 331 045 259 634 306 808 324 171 339 818 343 100 362 900 379 546 ·..<br />
European population••• , •••••• C 21 133 21 033 20 512 20 375 20 145 19 162 19 760 19 575 ·..<br />
Angola 3 [Port.] •••••••••••••••••• U 46638 52711 58365 53699 51 848 53416 60249 59593 61 965<br />
Bechuanaland [UK]:<br />
Non-indigenous population 4•••• C 76 58 75 65 78 90 79 81 ...<br />
Belgian Congo:<br />
Indigenous population••••••••• U ·.. ... .. . ... ... 357 782 371 740 412 286 ...<br />
White population••• , ••• , •••• ... 1 648 1 771 2 209 2 701 2 921 3 348 3 502 *3 884 .. ,<br />
Cape Verde Islands [Port.] •••••••• U6 3756 3904 5322 7367 7647 7597 8697 8547 8377<br />
Egypt•.•••••••••••••••••••••••• t U7 832728 831 310 904941 934584 969443 878459 .. . ... , "<br />
French West Africa:<br />
Dakar••••••••••• , ••••••••••• ... ·.. ... 8 999 9 770 9 955 10 929 12 958 12 530 14 780<br />
Gambia [UK]:<br />
Bathurst••••• , •••••••••••••••• ... 662 666 803 780 710 735 669 770 894<br />
Ghana 9•••••••••••••••••••••••• t U 10 14466 15483 14645 15335 15878 18181 .. . ·.. ·..<br />
Madagascar [Fr.] ••••• , •••••••••• U 103246 113078 131 480 132068 139859 149768 151480 167842 179570<br />
Mauritius ex. dep. [UK] •••••••••••• t C 19039 20472 23110 22968 24.120 23896 21 926 22970 24910<br />
Rodrigues••••••••••••••••••••. t C 390 459 557 575 569 532 587 642 756<br />
Morocco:<br />
Former French Zone<br />
Non-indigenous pop. 2, 11 •••• , • C 9 822 9 835 10 322 10 965 11 561 11 507 12 124 12 239 ...<br />
Former Spanish Zone<br />
Northern Zone 12 ••••••••••••• U13 18 911 16 574 18 903 17 741 16 430 15 932 23 865 32 539 ...<br />
Tangier•••••• , ••••••• ,." •• ,. U14 *1 078 .,. , .. .., ... .. . ... ·.. " .<br />
Mozambique [Port.] ••••••••••••••• U6 44725 53045 48709 50254 51 065 57323 50780 50824 ."<br />
Non-indigenous population 15••• C 2 684 2 860 3 128 3 302 3 437 3 644 3 783 ... '"<br />
Nigeria, Federation of [UK]:<br />
Lagos<br />
Indigenous population.• , •••••• .. . ... 9 986 12 659 14 253 12 144 12 197 12 707 14 093 15 339<br />
Portuguese Guinea ••••••••••••••• U 6 2164 3852 6802 9013 8372 .. . ... .. . , ..<br />
Reunion [Fr.] ••••••••••••••••••••• U 9932 10382 11714 11 684 13231 13597 13613 14082 ...<br />
Rhodesia and Nyasaland,<br />
Federation of [UK]:<br />
European population••• , •••••• t... ... 4 120 4 580 5 301 5 804 5 985 6 078 6 310 6 862<br />
Northern Rhodesia<br />
Indigenous population••••••••• .. . ... ... .. . , .. , .. ... ·.. ... ·..<br />
European population•••••••••. t... 840 850 1 036 1 200 1 318 1 450 1 686 1 814 2 076<br />
Nyasaland .••••••••••••••••••• t U 51 063 44 564 42 060 26 476 30 839 22 087 .. . ·.. ...<br />
European population•••••••••• t... '" 99 149 172 197 168 169 241 229<br />
Southern Rhodesia<br />
Indigenous population••••••••• .. . ... .. . '" .. . ... .. . ·.. ... ·..<br />
European population•••••••••• t C 2 863 3 171 3 396 3 929 4 289 4 367 4 223 4 266 4 667<br />
Ruanda-Urundi [Belg. Adm.]:<br />
Indigenous population.•••••••• ... ·.. .. . .. . .. . ... ... ·.. ... ...<br />
European population•••••••••. ... 127 99 127 161 204 209 187 .. . ...<br />
St. Helena ex. dep. [UK] ••••••••••• ... 157 149 136 134 149 140 121 140 127<br />
'* Provisio'nal.<br />
t Data known to be by year of registration rather than by year of<br />
occurrence.<br />
1 Data stated to be complete or virtually complete are coded "C"; those<br />
stated to be affected by irregularities in registration or incomplete<br />
coverage are coded "U".<br />
2 Data exclude live-born infants dying before registration of birth.<br />
3 Data are baptisms recorded in church registers.<br />
4 European, Indian and Coloured (mixed) population, together comprising<br />
about one per cent of the total.<br />
5 Official rates estimated from sample surveys of about 3.6 per cent of<br />
indigenous population; these surveys were discontinued in 1954 because<br />
they were found to be unrepresentative. A new sample of 3<br />
separate strata covering together about 12 per cent of the population<br />
is now in process.<br />
6 Registration believed to be complete for "civilized" population only,<br />
which represents a relatively small proportion of the total.<br />
162<br />
* Do,nnees provisoires.<br />
t Statistiques etablies selon I'annee de I'enregistrement et non I'annee<br />
de I'evenement.<br />
1 La lettre "C" designe les donnees considerees comme completes au<br />
protiquement completes; 10 lettre "U" les donnees considerees comme<br />
incompletes au faussees par des irregularites d'enregistrement.<br />
2 Non compris les enfants nes vivants et decedes avant I'enregistrement<br />
de leur naissance.<br />
3 O'apres les baptemes inscrits sur les registres des eglises.<br />
4 Europeans, personnes d'origine indienne et personnes de couleur<br />
(metis) representant ensemble 1 pour cent environ de 10 population<br />
totoIe.<br />
5 Estimations officielles etablies d'apres des sondages sur echantillon<br />
d'environ 3,6 pour cent de 10 population indigene; ces sondages ant<br />
ete interrompus en 1954, car II est apparu que I'echantillon n'etait<br />
pas representatif. Un nouvel echantillon de 3 strates distinctes representant<br />
ensemble environ 12 pour cent de 10 population totoIe a ete<br />
constitue pour Ie sandage en cours.<br />
6 L'enregistrement n'est probablement complet que pour 10 population<br />
llcivilisee ll , qui represente une fraction relativement foible de 10 popu·<br />
lotion totoIe.


