

1957 - United Nations Statistics Division
1957 - United Nations Statistics Division
1957 - United Nations Statistics Division

Create successful ePaper yourself
Turn your PDF publications into a flip-book with our unique Google optimized e-Paper software.
which data are available. This is not to say that male<br />
mortality is less favourable at every age, but that the<br />
crude male death rate is higher than the female by as<br />
much as 37% in the <strong>United</strong> States, 34% in Canada, 33%<br />
in Argentina, and 25% in Australia.<br />
Table E presents ratios of the male death rate to that<br />
for females, in 33 countries, during the latest year available<br />
and an earlier year.<br />
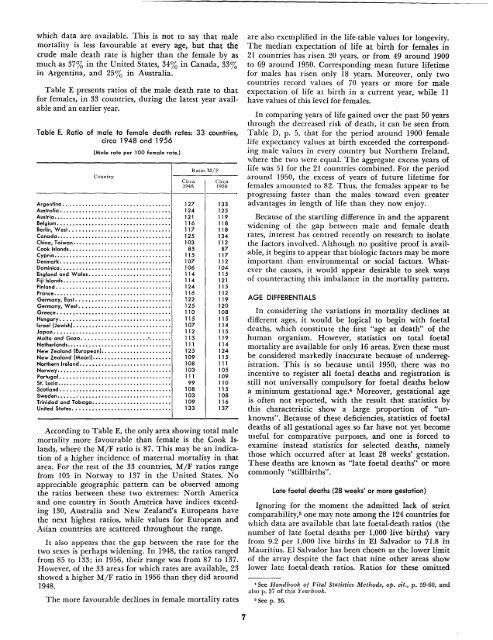
Table E. Ratio of male to female death rates: 33 countries,<br />
circa 1948 and 1956<br />
(Male rate per 100 female rate.)<br />
Country<br />
Argentina ••••••••••••••••••••••.•.•••.••••.<br />
Australia •.•••••••••••••••.•.•.•••••••••.•••<br />
Austria •••.•.•••••••••••••.•.•••••.•••••.•••<br />
Belgium ••.•••••••••.•••••••••••••.•.•••.•••<br />
Berlin, West•..•••••.•••••••.•••.•.•••••••..<br />
Canada••••••••••.•••••.••••••.•.••••.•••••<br />
China, Taiwan .<br />
Cook Islands••••••.•••.•.•.•••••••••••••..••<br />
Cyprus•••••••••••••••••••••••.•.••••..•••••<br />
Denmark•.•••••••••••••••••..••••.•.•••••••<br />
Dominica..•...........................•....<br />
England and Wales.•••.•.•..•••.•.••••••••••<br />
Fiji Islands•••••••••••••••••••.••••••.••.•••.<br />
Finland ••••••.•••••.•.•••••••.•.•••••••••••<br />
France•••.•••••.•••••.•.•••••••...•••••••••<br />
Germany, East••••••••••••••••••••••••••••.•<br />
Germany, West••••••••..•.•••••••.•••••••.•<br />
Greece••••••••••••••••••••••.•••••••••••••<br />
Hungary•••••••••••••.•••••••••••••••••••••<br />
Israel (Jewish) •••••••••••.•••••••••..••••.•.•<br />
Japan•••••.•.•.••••••••.••••••••••••••••.•<br />
Malta and Gozo '•...•••<br />
Netherlands•••••••••••••••.•••..••••••.•••••<br />
New Zealand (European)••••.•••••••••.•.•••••<br />
New Zealand (Maoril•••••••••••••••••.•.•••••<br />
Northern Ireland•••••••.•••••••••••••••••.•.•<br />
Norway••••••••.•••••••••••••••••.••.••••••<br />
Portugal•••••••••••••••••••••••••••.•••••••<br />
St. Lucia ••••••••••.•.•••••••••••••••••.•••.•<br />
Scotland •••••••••••••••••••••••••••••••.•.•<br />
Sweden••••.•••••••••••••••••••••••••••.•.•<br />
Trinidad and Tobago•••••••.•••••••.•.•••••••<br />
<strong>United</strong> States•.•••••••••••.•••••••••••••••••<br />
Ratio M/F<br />
Circa Circa<br />
1948 1956<br />
127<br />
124<br />
121<br />
116<br />
117<br />
125<br />
103<br />
85<br />
115<br />
107<br />
106<br />
114<br />
114<br />
124<br />
116<br />
122<br />
125<br />
110<br />
115<br />
107<br />
112<br />
113<br />
111<br />
125<br />
109<br />
108<br />
103<br />
111<br />
99<br />
108<br />
103<br />
109<br />
133<br />
133<br />
125<br />
119<br />
118<br />
118<br />
134<br />
112<br />
87<br />
117<br />
112<br />
104<br />
115<br />
121<br />
115<br />
112<br />
119<br />
120<br />
108<br />
115<br />
114<br />
115<br />
119<br />
114<br />
124<br />
115<br />
111<br />
105<br />
109<br />
110<br />
115<br />
108<br />
116<br />
137<br />
According to Table E, the only area showing total male<br />
mortality more favourable than female is the Cook Islands,<br />
where the MjF ratio is 87. This may be an indication<br />
of a higher incidence of maternal mortality in that<br />
area. For the rest of the 33 countries, MjF ratios range<br />
from 105 in Norway to 137 in the <strong>United</strong> States. No<br />
appreciable geographic pattern can be observed among<br />
the ratios between these two extremes: North America<br />
and one country in South America have indices exceeding<br />
130, Australia and New Zealand's Europeans have<br />
the next highest ratios, while values for European and<br />
Asian countries are scattered throughout the range.<br />
It also appears that the gap between the rate for the<br />
two sexes is perhaps widening. In 1948, the ratios ranged<br />
from 85 to 133; in 1956, their range was from 87 to 137.<br />
However, of the 33 areas for which rates are available, 23<br />
showed a higher MjF ratio in 1956 than they did around<br />
1948.<br />
The more favourable declines in female mortality rates<br />
1<br />
are also exemplified in the life-table values for longevity.<br />
The median expectation of life at birth for females in<br />
21 countries has risen 20 years, or from 49 around 1900<br />
to 69 around 1950. Corresponding mean future lifetime<br />
for males has risen only 18 years. Moreover, only two<br />
countries record values of 70 years or more for male<br />
expectation of life at birth in a current year, while 11<br />
have values of this level for females.<br />
In comparing years of life gained over the past 50 years<br />
through the decreased risk of death, it can be seen from<br />
Table D, p. 5, that for the period around 1900 female<br />
life expectancy values at birth exceeded the corresponding<br />
male values in every country but Northern Ireland,<br />
where the two were equal. The aggregate excess years of<br />
life was 51 for the 21 countries combined. For the period<br />
around 1950, the excess of years of future lifetime for<br />
females amounted to 82. Thus, the females appear to be<br />
progressing faster than the males toward even greater<br />
advantages in length of life than they now enjoy.<br />
Because of the startling difference in and the apparent<br />
widening of the gap between male and female death<br />
rates, interest has centred recently on research to isolate<br />
the factors involved. Although no positive proof is available,<br />
it begins to appear that biologic factors may be more<br />
important than environmental or social factors. Whatever<br />
the causes, it would appear desirable to seek ways<br />
of counteracting this imbalance in the mortality pattern.<br />
AGE DIFFERENTIALS<br />
In considering the variations in mortality declines at<br />
different ages, it would be logical to begin with foetal<br />
deaths, which constitute the first "age at death" of the<br />
human organism. However, statistics on total foetal<br />
mortality are available for only 16 areas. Even these must<br />
be considered markedly inaccurate because of underregistration.<br />
This is so because until 1950, there was no<br />
incentive to register all foetal deaths and registration is<br />
still not universally compulsory for foetal deaths below<br />
a minimum gestational age. 4 Moreover, gestational age<br />
is often not reported, with the result that statistics by<br />
this characteristic show a large proportion of "unknowns".<br />
Because of these deficiencies, statistics of foetal<br />
deaths of all gestational ages so far have not yet become<br />
useful for comparative purposes, and one is forced to<br />
examine instead statistics for selected deaths, namely<br />
those which occurred after at least 28 weeks' gestation.<br />
These deaths are known as "late foetal deaths" or more<br />
commonly "stillbirths".<br />
4 See Handbook of Vital <strong>Statistics</strong> Methods, op. cit., p. 59-60, and<br />
also p. 37 of this Yearbook.<br />
6 See p. 36.<br />
Late foetal deaths (28 weeks' or more gestation)<br />
Ignoring for the moment the admitted lack of strict<br />
comparability,5 one may note among the 124 countries for<br />
which data are available that late foetal-death ratios (the<br />
number of late foetal deaths per 1,000 live births) vary<br />
from 9.2 per 1,000 live births in El Salvador to 71.8 in<br />
Mauritius. EI Salvador has been chosen as the lower limit<br />
of the array despite the fact that nine other areas show<br />
lower late foetal-death ratios. Ratios for these omitted


