

1957 - United Nations Statistics Division
1957 - United Nations Statistics Division
1957 - United Nations Statistics Division

Create successful ePaper yourself
Turn your PDF publications into a flip-book with our unique Google optimized e-Paper software.
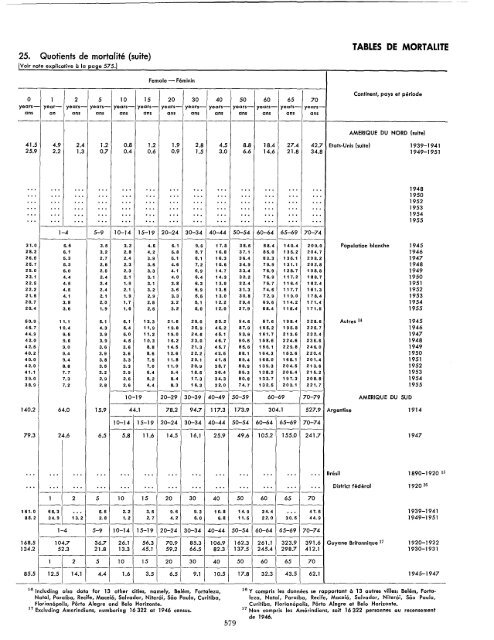
25. Quotients de mortalite (suite)<br />
[Voir note explicative a la page 575]<br />
Female - Feminin<br />
0 1 2 5 10 15 20 30 40 50 60 65 70<br />
years- year- years- years- years- years- years- years- years- years- years- years- yearsans<br />
an ans ans ans ans ans ans ans ans ans ans ans<br />
------------------------------------<br />
TABLES DE MORTALITE<br />
Continent, pays et periode<br />
AMERIQUE DU NORD (suite)<br />
41.5 4.9 2.4 1.2 0.8 1.2 1.9 2.8 4.5 8.8 18.4 27.4 42.7 Etats-Unis (suite) 1939-1941<br />
25.9 2.2 1.3 0.7 0.4 0.6 0.9 1.5 3.0 6.6 14.6 21.8 34.8 1949-1951<br />
... .. . ... ... .. ,<br />
... .,. ... ... .. ,<br />
'" ., . " . '" ... ... ... ... 1948<br />
'" ... '" ... " . ... '" ... 1950<br />
'" .. . ... ... ... ... ... ... ... ... '" ., . ... 1952<br />
... .,. ... '" .. ,<br />
'" ., . . " '" '" " . ... ... 1953<br />
'" ... '" .. . ... . " ... '" .. . '" . " ... " . 1954<br />
" . .. . ... . " ... '" ... .. . .. . ... ... ... " . 1955<br />
------------------------------------<br />
1-4 5-9 10-14 15-19 20-24 30-34 40-44 50-54 60-64 65-69 70-74<br />
------------------------<br />
31.0 6.5 3.5 3.2 4.5 6.1 9.6 17.8 38.5 88.4 140.4 209.0 Population blanche 1945<br />
28.2 6.1 3.2 2.8 4.2 5.8 8.7 16.8 37.1 85.0 135.2 204.7 1946<br />
26.6 5.3 2.7 2.4 3.9 5.1 8.1 16.3 36.4 83.3 135.1 208.2 1947<br />
25.7 5.3 2.6 2.3 3.6 4.6 7.2 15.6 34.9 79.9 131.1 202.8 1948<br />
25.0 5.0 2.5 2.3 3.3 4.1 6.9 14.7 33.4 76.9 128.7 198.8 1949<br />
23.1 4.4 2.4 2.1 3.1 4.0 6.4 14.3 32.2 76.9 117.2 188.7 1950<br />
22.5 4.5 2.4 1.9 3.1 3.8 6.3 13.9 32.4 75.7 116.4 182.4 1951<br />
22.2 4.5 2.4 2.1 3.2 3.6 5.9 13.5 31.3 74.6 117.7 181.3 1952<br />
21.5 4.1 2.1 1.9 2.9 3.3 5.5 13.0 30.8 72.9 119.0 178.4 1953<br />
20.7 3.8 2.0 1.7 2.5 3.2 5.1 12.2 29.4 69.6 114.2 171.4 1954<br />
20.4 3.6 1.9 1.6 2.6 3.2 5.0 12.0 27.9 68.4 115.4 171.5 1955<br />
50.9 11.1 5.1 6.1 13.3 21.6 29.0 50.2 94.6 57.6 198.4 228.6 Autres 14 1945<br />
45.7 10.4 4.3 5.4 11.9 19.8 25.9 46.2 87.9 155.2 195.8 225.7 1946<br />
44.9 9.5 3.9 5.0 11.2 19.0 24.6 45.1 93.6 161.7 213.6 232.4 1947<br />
42.0 9.6 3.9 4.5 10.3 16.2 23.0 46.7 90.5 158.6 224.6 236.6 1948<br />
42.5 9.0 3.6 3.6 8.8 14.5 21.3 46.7 85.5 156.1 229.8 246.0 1949<br />
40.2 9.4 3.9 3.6 8.6 12.6 22.2 43.5 88.1 164.3 153.6 220.4 1950<br />
40.0 9.4 3.8 3.3 7.5 11.8 20.1 41.8 89.4 165.0 165.1 201.4 1951<br />
42.0 8.8 3.5 3.3 7.0 11.0 20.9 38.7 88.9 139.3 204.5 213.6 1952<br />
41.1 7.7 3.2 2.9 6.4 9.4 18.5 35.4 85.3 138.2 205.4 215.2 1953<br />
39.0 7.3 2.9 2.6 5.2 8.4 17.3 34.3 80.8 133.7 197.3 208.8 1954<br />
38.9 7.2 2.8 2.6 4.4 8.3 16.3 32.0 74.7 132.5 203.1 221.7 1955<br />
---------------------------<br />
10-19 20-29 30-39 40-49 50-59 60-69 70-79 AMERIQUE DU SUD<br />
------<br />
140.2 64.0 15.9 44.1 78.2 94.7 117.3 173.9 304.1 527.9 Argentine 1914<br />
---------------------------<br />
10-14 15-19 20-24 30-34 40-44 50-54 60-64 65-69 70-74<br />
---------------------------<br />
79.3 24.6 6.5 5.8 11.6 14.5 16.1 25.9 49.6 105.2 155.0 241.7 1947<br />
'" .. , ... '" '" '" ... '" '" . " ... .. . ... Bresil 1890-1920 15<br />
... .. . ... '" ... " . .., ... '" . " ... ... ... District fed eral 1920 16<br />
------------------------------------<br />
1 2 5 10 15 20 30 40 50 60 65 70<br />
------------------------------------<br />
151.0 65.3 ... 5.5 2.2 3.5 9.6 9.3 10.8 14.9 24.4 .. , 47.5 1939-1941<br />
88.2 34.9 13.2 2.8 1.2 2.7 4.2 5.0 5.8 11.5 22.0 30.5 44.9 1949-1951<br />
------------------------------------<br />
1-4 5-9 10-14 15-19 20-24 30-34 40-44 50-54 60-64 65-69 70-74<br />
---------------------------<br />
168.5 104.7 36.7 26.1 56.3 70.9 85.3 106.9 162.3 261.1 323.9 391.6 Guyane Britannique 17 1920-1922<br />
134.2 52.3 21.8 13.3 45.1 59.2 66.5 82.3 137.5 245.4 298.7 412.1 1930-1931<br />
------------------------------------<br />
1 2 5 10 15 20 30 40 50 60 65 70<br />
------------------------------------<br />
B5.5 12.5 14.1 4.4 1.6 3.5 6.5 9.1 10.5 17.B 32.3 43.5 62.1 1945-1947<br />
16 Including also data for 13 other cities, namely, Belem, Fortaleza,<br />
Natal, Paraiba, Recife, Macei6, Salvador, Niter6i, Sao Paulo, Curitiba,<br />
Florian6polis, Porto Alegre and Bela Horizonte.<br />
17 Excluding Amerindians, numbering 16322 at 1946 census.<br />
579<br />
16 Y compris les donnees se rapportant a 13 autres villes: Belem, Fortaleze,<br />
NatalI' Paraibo, Recife, Maceio, Salvador, Niter6i, Sao Paulo,<br />
Curitiba, Florianapolis, Porto Alegre et Bela Horizonte.<br />
17 Non compris les Amerindiens, soit 16322 personnes au recensement<br />
de 1946.


