

1957 - United Nations Statistics Division
1957 - United Nations Statistics Division
1957 - United Nations Statistics Division

You also want an ePaper? Increase the reach of your titles
YUMPU automatically turns print PDFs into web optimized ePapers that Google loves.
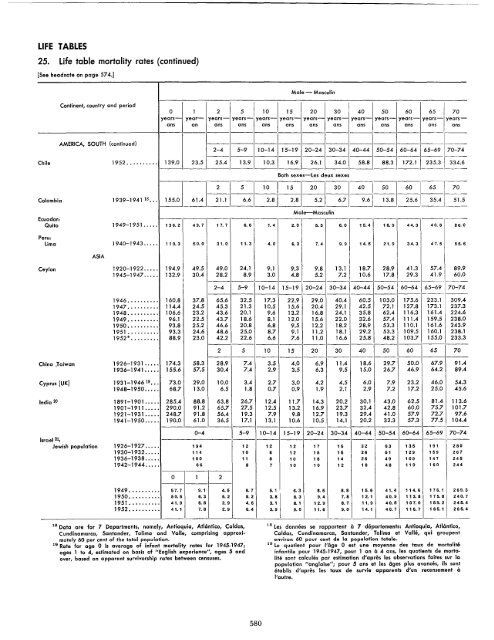
LIFE TABLES<br />
25. Life table mortality rates (continued)<br />
[See headnote on page 574.]<br />
Continent, country and period<br />
Male - Masculin<br />
0 1 2 5 10 15 20 30 40 50 60 65 70<br />
years- year- years- years- years- years- years- years- years- years- years- years- yearsans<br />
an ans ans ans ans ans ans ans ans ans ans ans<br />
------------------------------------<br />
AMERICA, SOUTH (continued) ---------------------------------<br />
2-4 5-9 10-14 15-19 20-24 30-34 40-44 50-54 60-64 65-69 70-74<br />
---------------------------------<br />
Chile 1952.......... 139.0 23.5 25.4 13.9 10.3 16.9 26.1 34.0 58.8 88.3 172.1 235.3 334.6<br />
---------------------------------------<br />
Both sexes-les deux sexes<br />
--------------------------------_._-----<br />
I<br />
2 5 10 15 20 30 40 50 60 65 70<br />
I<br />
--------------------------1-----<br />
Colombia 1939-1941 18 ... 155.0 61.4 21.1 6.6 2.8 2.8 5.2 6.7 9.6 13.8 25.6 I 35.4 51.5<br />
---------------------------------'------<br />
Ecuador:<br />
Quito<br />
Male-Masculin<br />
---------------------------------------<br />
1949-1951..... 136.2 43.7 17.7 6.6 1.4 2.0 6.5 6.0 15.4 16.9 44.3 40.8 86.0<br />
Peru:<br />
lima 1940-1943..... 119.3 50.0 31.0 11.3 4.0 6.3 7.4 9.9 14.5 21.9 34.3 47.5 55.6<br />
ASIA<br />
Ceylon 1920-1922..... 194.9 49.5 49.0 24.1 9.1 9.3 9.8 13.1 18.7 28.9 41.3 57.4 89.9<br />
1945-1947...•. 132.9 30.4 28.2 8.9 3.0 4.8 5.2 7.2 10.6 17.8 29.3 41.9 60.0<br />
---------------------------------<br />
2-4 5-9 10-14 15-19 20-24 30-34 40-44 50-54 60-64 65-69 70-74<br />
---------------------------------<br />
1946.•....•.•. 160.8 37.8 65.6 32.5 17.3 22.9 29.0 40.4 60.5 103.0 175.6 233.1 309.4<br />
1947......•... 114.4 24.5 45.3 21.3 10.5 15.6 20.4 29.1 42.5 72.1 127.8 173.1 237.3<br />
1948••••••..•. 106.6 23.2 43.6 20.1 9.6 13.2 16.8 24.1 35.8 62.4 116.3 161.4 224.6<br />
1949•••••••••. 96.1 22.5 43.7 18.6 8.1 12.0 15.6 22.0 32.6 57.4 111.4 159.5 238.0<br />
1950••.••••••. 93.8 25.2 46.6 20.8 6.8 9.5 12.2 18.2 28.9 53.3 110.1 161.6 243.9<br />
1951 .......... 93.3 24.6 48.6 25.0 8.7 9.1 11.2 18.1 29.2 53.3 109.5 160.1 238.1<br />
1952*......... 88.9 23.0 42.2 22.6 6.6 7.6 11.0 16.6 25.8 48.2 103.7 155.0 233.3<br />
---------------------------------<br />
2 5 10 15 20 30 40 50 60 65 70<br />
---------------------------------<br />
China ,Taiwan 1926-1931 ..... 174.3 58.3 28.9 7.4 3.5 4.0 6.9 11.4 18.6 29.7 50.0 67.9 91.4<br />
1936-1941 ..... 155.6 57.5 30.4 7.4 2.9 3.5 6.3 9.5 15.0 26.7 46.9 64.2 89.4<br />
Cyprus [UK) 1931-1946 19 ... 73.0 29.0 10.0 3.4 2.7 3.0 4.2 4.5 6.0 7.9 23.2 46.0 54.3<br />
1948-1950..... 68.7 13.0 6.5 1.8 0.7 0.9 1.9 2.1 2.9 7.2 17.2 25.0 45.6<br />
India 20 1891-1901 ..... 285.4 88.8 63.8 26.7 12.4 11.7 14.3 20.2 30.1 43.0 62.5 81.4 113.6<br />
1901-1911 ..... 290.0 91.2 65.7 27.5 12.5 13.2 16.9 23.7 32.4 42.8 60.0 75.7 101.7<br />
1921-1931 ..... 248.7 91.8 56.4 19.3 7.9 9.8 12.7 19.3 29.4 41.0 57.9 72.7 97.6<br />
1941-1950..... 190.0 61.0 36.5 17.1 13.1 10.6 10.5 14.1 20.2 32.3 57.3 77.5 104.4<br />
---------------------------------------<br />
0-4 5-9 10-14 15-19 20-24 30-34 40-44 50-54 60-64 65-69 70-74<br />
Israel 21: ---------------------------<br />
Jewish population 1926-1927..... 194 12 12 12 17 16 32 63 135 191 280<br />
1930-1932•.•.. 114 10 6 12 15 15 26 51 129 159 267<br />
1936-1938..... 100 11 8 10 18 14 25 49 109 147 245<br />
1942-1944..••. 66 8 7 10 10 12 18 48 110 160 244<br />
---------<br />
0 1 2<br />
---------<br />
1949•••••.•... 57.7 9.1 4.5 6.7 5.1 6.3 8.5 8.8 15.6 41.4 114.6 176.1 269.3<br />
1950••••..•... 50.5 6.3 5.2 5.2 3.8 8.3 9.4 7.8 12.1 40.9 113.8 175.8 240.7<br />
1951 •••••.•••. 41.9 6.8 2.9 4.6 3.1 8.1 12.9 8.7 11.9 40.6 107.0 169.2 245.4<br />
1952 •••••••... 41.1 7.8 2.9 6.4 3.9 9.0 11.6 9.0 14.1 40.7 116.7 166.1 265.4<br />
18 Data are for 7 Departments, namely, Antioquia, Atlantico, Caldas,<br />
Cundinamarca, Santander, Tolima and Valle, comprising approxi·<br />
mately 60 per cent of the total population.<br />
19 Rate for age 0 is average of infont mortality rates for 1945-1947;<br />
ages 1 to 4, estimated on basis of "English experience", ages 5 and<br />
over, based on apparent survivorship rates between censuses.<br />
580<br />
18 les donnees se rapportent a 7 departements: Antioquia, Atlantico,<br />
Caldas,Cundinamarca, Santander, Tolima et Valle, qui groupent<br />
environ 60 pour cent de 10 population fotate.<br />
19 le quotient pour I'age 0 est une moyenne des taux de mortalite<br />
infantile pour 1945-1947, pour 1 an a 4 ans, les quotients de mortalite<br />
sont caleules par estimation d'apres les observations faites sur la<br />
population "anglaise"; pour 5 ans et les ages plus avances, i1s sont<br />
&tablis d'apres les taux de survie apparents d'un recensement a<br />
I'autre.<br />
I


