renewables – Made in Germany
renewables – Made in Germany
renewables – Made in Germany

You also want an ePaper? Increase the reach of your titles
YUMPU automatically turns print PDFs into web optimized ePapers that Google loves.
global <strong>in</strong>stalled capacity (MW)<br />
250,000<br />
200,000<br />
150,000<br />
100,000<br />
50,000<br />
0<br />
59,091<br />
global <strong>in</strong>stalled capacity<br />
newly <strong>in</strong>stalled capacity<br />
11,531 15,245<br />
74,052<br />
19,866<br />
93,820<br />
26,560<br />
120,291<br />
2005 2006 2007 2008 2009 2010<br />
Currently, most of the world’s turb<strong>in</strong>es are<br />
<strong>in</strong>stalled on land. In future, their numbers will cont<strong>in</strong>ue<br />
to grow ma<strong>in</strong>ly on land, both <strong>in</strong> Europe and<br />
worldwide. But the development of offshore w<strong>in</strong>d<br />
farms will become more important over the next few<br />
years. Much experience with offshore �p 10 projects<br />
has also already been ga<strong>in</strong>ed <strong>in</strong> over 30 offshore w<strong>in</strong>d<br />
farms built off the coasts of Great Brita<strong>in</strong>, Denmark,<br />
Sweden, Ireland, the Netherlands and <strong>Germany</strong>. Given<br />
the consistent w<strong>in</strong>d conditions and higher average<br />
w<strong>in</strong>d speeds at sea, the expected energy yields are up<br />
to 35 % higher than those on land. The German government<br />
has forecast an <strong>in</strong>stalled capacity of up to<br />
25 GW by 2030, so German maritime w<strong>in</strong>d farms could<br />
meet up to 15 % of the country’s power requirements<br />
<strong>in</strong> the long term. Construction of the first commercial<br />
offshore w<strong>in</strong>d farms ‘Baltic 1’ <strong>in</strong> the Baltic Sea and<br />
‘Bard Offshore 1’ <strong>in</strong> the North Sea <strong>in</strong> 2010 was a major<br />
milestone <strong>in</strong> the development of offshore w<strong>in</strong>d<br />
energy use.<br />
One of the ma<strong>in</strong> challenges for offshore systems is<br />
the strong dependence on weather conditions dur<strong>in</strong>g<br />
construction. The ma<strong>in</strong> construction phase is limited<br />
to a period between April and November and is very<br />
dependent on wave heights and w<strong>in</strong>d speeds. These<br />
<strong>in</strong>calculable parameters can significantly impact the<br />
overall cost of a project. Dur<strong>in</strong>g operation, salty air<br />
also makes heavy demands on the materials used. The<br />
multi-megawatt turb<strong>in</strong>es and components used <strong>in</strong> offshore<br />
areas were for the most part developed, manufactured<br />
and tested <strong>in</strong> small series on land <strong>in</strong> <strong>Germany</strong>.<br />
38,610 35,802<br />
158,738<br />
194,390<br />
50,000<br />
40,000<br />
30,000<br />
20,000<br />
10,000<br />
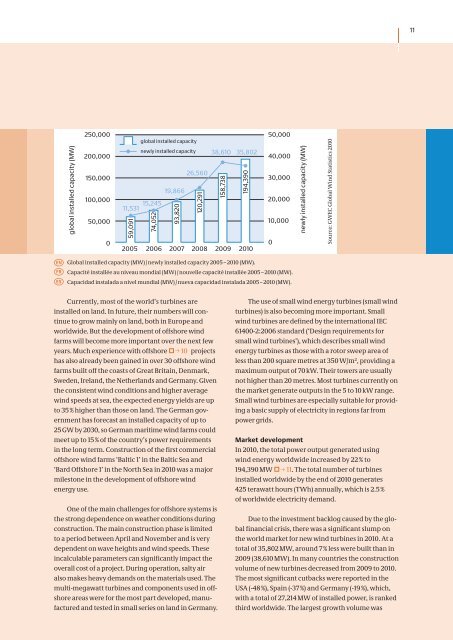
g Global <strong>in</strong>stalled capacity (MW) / newly <strong>in</strong>stalled capacity 2005 <strong>–</strong> 2010 (MW).<br />
f Capacité <strong>in</strong>stallée au niveau mondial (MW) / nouvelle capacité <strong>in</strong>stallée 2005 <strong>–</strong> 2010 (MW).<br />
e Capacidad <strong>in</strong>stalada a nivel mundial (MW) / nueva capacidad <strong>in</strong>stalada 2005 <strong>–</strong> 2010 (MW).<br />
0<br />
newly <strong>in</strong>stalled capacity (MW)<br />
Source: GWEC Global W<strong>in</strong>d Statistics 2010<br />
The use of small w<strong>in</strong>d energy turb<strong>in</strong>es (small w<strong>in</strong>d<br />
turb<strong>in</strong>es) is also becom<strong>in</strong>g more important. Small<br />
w<strong>in</strong>d turb<strong>in</strong>es are def<strong>in</strong>ed by the <strong>in</strong>ternational IEC<br />
61400-2:2006 standard (‘Design requirements for<br />
small w<strong>in</strong>d turb<strong>in</strong>es’), which describes small w<strong>in</strong>d<br />
energy turb<strong>in</strong>es as those with a rotor sweep area of<br />
less than 200 square metres at 350 W/m 2 , provid<strong>in</strong>g a<br />
maximum output of 70 kW. Their towers are usually<br />
not higher than 20 metres. Most turb<strong>in</strong>es currently on<br />
the market generate outputs <strong>in</strong> the 5 to 10 kW range.<br />
Small w<strong>in</strong>d turb<strong>in</strong>es are especially suitable for provid<strong>in</strong>g<br />
a basic supply of electricity <strong>in</strong> regions far from<br />
power grids.<br />
Market development<br />
In 2010, the total power output generated us<strong>in</strong>g<br />
w<strong>in</strong>d energy worldwide <strong>in</strong>creased by 22 % to<br />
194,390 MW �p 11. The total number of turb<strong>in</strong>es<br />
<strong>in</strong>stalled worldwide by the end of 2010 generates<br />
425 terawatt hours (TWh) annually, which is 2.5 %<br />
of worldwide electricity demand.<br />
Due to the <strong>in</strong>vestment backlog caused by the global<br />
f<strong>in</strong>ancial crisis, there was a significant slump on<br />
the world market for new w<strong>in</strong>d turb<strong>in</strong>es <strong>in</strong> 2010. At a<br />
total of 35,802 MW, around 7 % less were built than <strong>in</strong><br />
2009 (38,610 MW). In many countries the construction<br />
volume of new turb<strong>in</strong>es decreased from 2009 to 2010.<br />
The most significant cutbacks were reported <strong>in</strong> the<br />
USA (-48 %), Spa<strong>in</strong> (-37 %) and <strong>Germany</strong> (-19 %), which,<br />
with a total of 27,214 MW of <strong>in</strong>stalled power, is ranked<br />
third worldwide. The largest growth volume was<br />
11