Relazione opinione studenti a.a. 2005-06 - Università di Bologna
Relazione opinione studenti a.a. 2005-06 - Università di Bologna
Relazione opinione studenti a.a. 2005-06 - Università di Bologna

Create successful ePaper yourself
Turn your PDF publications into a flip-book with our unique Google optimized e-Paper software.
ALMA MATER STUDIORUM UNIVERSITA’ DI BOLOGNA<br />
NUCLEO DI VALUTAZIONE DI ATENEO<br />
Il risultato molto analogo relativo all’intero Ateneo conferma il fatto che la <strong>di</strong>fferenza tra i<br />
rispondenti in<strong>di</strong>cata al precedente punto 1) non toglie significatività al confronto. Il fatto che per<br />
alcune facoltà il giu<strong>di</strong>zio dei laurean<strong>di</strong> sul corso da loro seguito sia molto più alto rispetto ai giu<strong>di</strong>zi<br />
attualmente espressi dagli <strong>studenti</strong> frequentanti, e per altre accada invece il contrario, come è<br />
evidenziato dalla rappresentazione della <strong>di</strong>spersione presentata nella Figura 3, merita <strong>di</strong> essere<br />
analizzato dalle facoltà interessate.<br />
Un confronto con gli analoghi dati relativi all’anno precedente mostra che il dato complessivo<br />
<strong>di</strong> Ateneo è sostanzialmente identico per il gra<strong>di</strong>mento <strong>studenti</strong>, mentre mostra un calo lieve ma non<br />
trascurabile (da 76,4 a 75,7) per i laurean<strong>di</strong>. Ancor più significativo è il confronto <strong>di</strong>saggregato sulle<br />
facoltà: le variazioni tra i due anni sono talora piuttosto notevoli.<br />
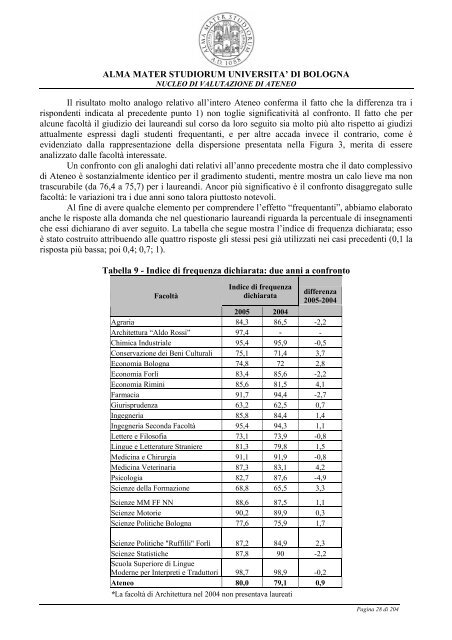
Al fine <strong>di</strong> avere qualche elemento per comprendere l’effetto “frequentanti”, abbiamo elaborato<br />
anche le risposte alla domanda che nel questionario laurean<strong>di</strong> riguarda la percentuale <strong>di</strong> insegnamenti<br />
che essi <strong>di</strong>chiarano <strong>di</strong> aver seguito. La tabella che segue mostra l’in<strong>di</strong>ce <strong>di</strong> frequenza <strong>di</strong>chiarata; esso<br />
è stato costruito attribuendo alle quattro risposte gli stessi pesi già utilizzati nei casi precedenti (0,1 la<br />
risposta più bassa; poi 0,4; 0,7; 1).<br />
Tabella 9 - In<strong>di</strong>ce <strong>di</strong> frequenza <strong>di</strong>chiarata: due anni a confronto<br />
Facoltà<br />
In<strong>di</strong>ce <strong>di</strong> frequenza<br />
<strong>di</strong>chiarata<br />
<strong>di</strong>fferenza<br />
<strong>2005</strong>-2004<br />
<strong>2005</strong> 2004<br />
Agraria 84,3 86,5 -2,2<br />
Architettura “Aldo Rossi” 97,4 - -<br />
Chimica Industriale 95,4 95,9 -0,5<br />
Conservazione dei Beni Culturali 75,1 71,4 3,7<br />
Economia <strong>Bologna</strong> 74,8 72 2,8<br />
Economia Forlì 83,4 85,6 -2,2<br />
Economia Rimini 85,6 81,5 4,1<br />
Farmacia 91,7 94,4 -2,7<br />
Giurisprudenza 63,2 62,5 0,7<br />
Ingegneria 85,8 84,4 1,4<br />
Ingegneria Seconda Facoltà 95,4 94,3 1,1<br />
Lettere e Filosofia 73,1 73,9 -0,8<br />
Lingue e Letterature Straniere 81,3 79,8 1,5<br />
Me<strong>di</strong>cina e Chirurgia 91,1 91,9 -0,8<br />
Me<strong>di</strong>cina Veterinaria 87,3 83,1 4,2<br />
Psicologia 82,7 87,6 -4,9<br />
Scienze della Formazione 68,8 65,5 3,3<br />
Scienze MM FF NN 88,6 87,5 1,1<br />
Scienze Motorie 90,2 89,9 0,3<br />
Scienze Politiche <strong>Bologna</strong> 77,6 75,9 1,7<br />
Scienze Politiche "Ruffilli" Forlì 87,2 84,9 2,3<br />
Scienze Statistiche 87,8 90 -2,2<br />
Scuola Superiore <strong>di</strong> Lingue<br />
Moderne per Interpreti e Traduttori 98,7 98,9 -0,2<br />
Ateneo 80,0 79,1 0,9<br />
*La facoltà <strong>di</strong> Architettura nel 2004 non presentava laureati<br />
Pagina 28 <strong>di</strong> 204