emergence of beans and has reported significant correlations between field emergenceand laboratory tests. The conductivity test (Kolasinska et al., 2000; Palabıyık,Peksen, 2008) gave reliable estimates of potential field emergence for common bean.Further, the tetrazolium test correlates with field emergence but the correlations werenot as high as those for a standard germination test (Kaymak, Guvenc, 2008) and thecold test is one of the oldest and most popular seed vigour tests (Vie<strong>ir</strong>a et al., 2010).The cold test and the accelerated aging test are recommended by Miguel and Cicero(1999) and Binotti et al. (2008). As reported by Vie<strong>ir</strong>a et al. (1999), Kolasinska et al.(2000), Muasya and Auma (2003) and Kaymak and Guvenc (2008), the relationshipbetween laboratory tests and field emergence is complex and variable.Interest in d<strong>ir</strong>ect, multi-element analysis of plant samples has increased in the lastfew years and includes X-ray fluorescence spectrometry (XRF). Simplicity of samplepreparation, minimum need for manipulation, speed and the opportunity of analyzingseveral different elements have promoted XRF as a useful alternative to conventionalspectroscopic techniques (Margui et al., 2005). In addition the short analysis time ofthis method makes it suitable for routine analyses (Noda et al., 2006), and useful todetermine seed element content and seed quality ind<strong>ir</strong>ectly.Although many researchers have shown significant correlations between fieldemergence and seed quality tests, such as counting the number of seed with brokencoats, electrical conductivity of seed leakage, the cold test and tetrazolium viabilitytests, controversial results in predicting field emergence have been reported and mosttests do not cover the relationship between seed element content and field emergence.Therefore, the aim of this paper was to study the application of wavelength-dispersiveXRF spectrometry for testing seed viability and vigour.Object, methods and conditions. This study was conducted under field andlaboratory conditions during 2004–2005 at Ataturk University, College of Agriculture,Erzurum, Turkey, to determine the application of wavelength-dispersive XRFspectrometry for testing seed viability and vigour. Seed of four green bean (Phaseolusvulgaris L.) cultivars (‘Gina’, ‘Sarıkız’, ‘Balkız’ and ‘Sırık-Ayse’) were used andseeds of vegetable species were supplied by vegetables seed companies in Turkey.S t a n d a r d g e r m i n a t i o n t e s t: Standard germination tests (SGT) wereconducted using four replicates of 25 seed of each cultivar. Seed was incubated inPetri dishes between two filter papers saturated with water, which contained Benlate1 g l -1 to prevent fungal growth at 20 °C (ISTA, 1996). Visible radicle protrusion wasthe criterion of germination. Germinated seeds were recorded and discarded at 24 hintervals over 10 days scoring. Results were expressed as final germination percentage.G e r m i n a t i o n r a t e ( G R ): GR was calculated according to the equation(germination rate = germination percentage in 1 st day/1 + ….. + germination percentagenth day/n) of Kaymak et al. (2009) and Kaymak (2012).F i e l d e m e r g e n c e ( F E ): To assess FE, seed from each sample was handsown at 5 cm deep in four replicate plots (Kolasinska et al., 2000). Seed was sownat three sowing dates [(early: May 2 (FE-I), optimum: May 20 (FE – II) and late:June 7 (FE – III)] into a loamy soil in north-eastern Turkey in 2004. The experimentalarea (Erzurum) is located between 40° 57’ and 39° 10’N latitude, 40° 15’ and42° 35’E longitude and is at 1 850 m above sea level. Counts started as seedlings beganto emerge and continued until no further seedlings appeared. Seedlings were countedas emerged when the cotyledons were free of the soil surface (Kolasinska et al., 2000).48
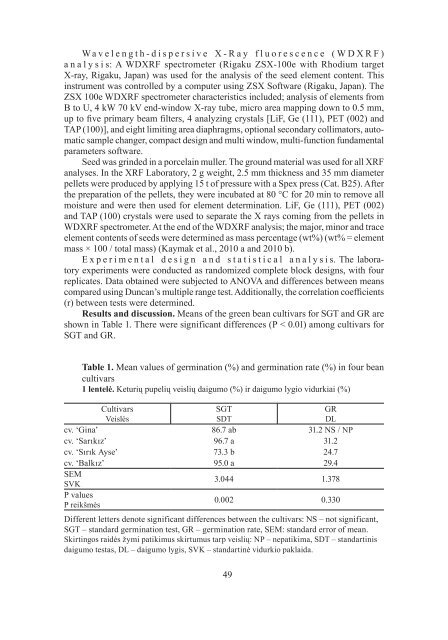
Wa v e l e n g t h - d i s p e r s i v e X - R a y f l u o r e s c e n c e ( W D X R F )a n a l y s i s: A WDXRF spectrometer (Rigaku ZSX-100e with Rhodium targetX-ray, Rigaku, Japan) was used for the analysis of the seed element content. Thisinstrument was controlled by a computer using ZSX Software (Rigaku, Japan). TheZSX 100e WDXRF spectrometer characteristics included; analysis of elements fromB to U, 4 kW 70 kV end-window X-ray tube, micro area mapping down to 0.5 mm,up to five primary beam filters, 4 analyzing crystals [LiF, Ge (111), PET (002) andTAP (100)], and eight limiting area diaphragms, optional secondary collimators, automaticsample changer, compact design and multi window, multi-function fundamentalparameters software.Seed was grinded in a porcelain muller. The ground material was used for all XRFanalyses. In the XRF Laboratory, 2 g weight, 2.5 mm thickness and 35 mm diameterpellets were produced by applying 15 t of pressure with a Spex press (Cat. B25). Afterthe preparation of the pellets, they were incubated at 80 °C for 20 min to remove allmoisture and were then used for element determination. LiF, Ge (111), PET (002)and TAP (100) crystals were used to separate the X rays coming from the pellets inWDXRF spectrometer. At the end of the WDXRF analysis; the major, minor and traceelement contents of seeds were determined as mass percentage (wt%) (wt% = elementmass × 100 / total mass) (Kaymak et al., 2010 a and 2010 b).E x p e r i m e n t a l d e s i g n a n d s t a t i s t i c a l a n a l y s i s. The laboratoryexperiments were conducted as randomized complete block designs, with fourreplicates. Data obtained were subjected to ANOVA and differences between meanscompared using Duncan’s multiple range test. Additionally, the correlation coefficients(r) between tests were determined.Results and discussion. Means of the green bean cultivars for SGT and GR areshown in Table 1. There were significant differences (P < 0.01) among cultivars forSGT and GR.Table 1. Mean values of germination (%) and germination rate (%) in four beancultivars1 lentelė. Keturių pupelių veislių daigumo (%) <strong>ir</strong> daigumo lygio vidurkiai (%)CultivarsVeislėsSGTSDTGRDLcv. ‘Gina’ 86.7 ab <strong>31</strong>.2 NS / NPcv. ‘Sarıkız’ 96.7 a <strong>31</strong>.2cv. ‘Sırık Ayse’ 73.3 b 24.7cv. ‘Balkız’ 95.0 a 29.4SEMSVK3.044 1.378P valuesP reikšmės0.002 0.330Different letters denote significant differences between the cultivars: NS – not significant,SGT – standard germination test, GR – germination rate, SEM: standard error of mean.Sk<strong>ir</strong>tingos raidės žymi patikimus sk<strong>ir</strong>tumus tarp veislių: NP – nepatikima, SDT – standartinisdaigumo testas, DL – daigumo lygis, SVK – standartinė vidurkio paklaida.49
- Page 3 and 4: LIETUVOS AGRARINIŲ IR MIŠKŲ MOKS
- Page 5 and 6: RNR degradacijos.D a u g i n a m o
- Page 7 and 8: 2 lentelės tęsinysTable 2 continu
- Page 9 and 10: 29 - ‘Connel Red’; 30 - ‘Paul
- Page 11 and 12: genetinių išteklių sodo virusini
- Page 13: Examined 35 apple varieties (entere
- Page 16 and 17: Įvadas. Antioksidantai įvairiais
- Page 18 and 19: metodo, kuriuo galima tiksliai įve
- Page 20 and 21: esant didesniems vandens kiekiams (
- Page 22 and 23: įmontuodami dviejų kelių vožtuv
- Page 24 and 25: standartiniams antioksidantams tirt
- Page 26 and 27: S p e k t r o f o t o m e t r i n i
- Page 28 and 29: nustatyti optimalias žaliavos ar p
- Page 30 and 31: 22. Devasagayam T. P., Tilak J. C.,
- Page 32 and 33: 52. Miller N. J., Rice-Evans C. A.,
- Page 34 and 35: 81. van den Berg R., Haenen G. R. M
- Page 37 and 38: LIETUVOS AGRARINIŲ IR MIŠKŲ MOKS
- Page 39 and 40: ų daigai pasodinti į nuolatinę a
- Page 41 and 42: Didžiausią suminį (279 vnt.) ir
- Page 43 and 44: 5 pav. Tirpių sausųjų medžiagų
- Page 45 and 46: Literatūra1. Bertin N., Guichard S
- Page 47: SCIENTIFIC WORKS OF THE INSTITUTE O
- Page 51: Table 2 continued2 lentelės tęsin
- Page 54 and 55: Table 4. Cumulative correlation bet
- Page 56 and 57: 9. Kaymak H. C., Güvenç İ., Yara
- Page 59 and 60: LIETUVOS AGRARINIŲ IR MIŠKŲ MOKS
- Page 61 and 62: 2003). Principinių koordinačių a
- Page 63 and 64: 1 pav. Laiškinio česnako (Allium
- Page 65: 8. Tarakanovas P., Raudonius S. 200
- Page 68 and 69: augalų ir daržovių kolekcija, ku
- Page 70 and 71: Oro temperatūra 2008 m. buvo 1,9
- Page 72 and 73: (5,5 cm) ir ‘ Dark Opal’ (5,1 c
- Page 74 and 75: 3. Produktyviausi yra ‘Genovese
- Page 77 and 78: LIETUVOS AGRARINIŲ IR MIŠKŲ MOKS
- Page 79 and 80: DSV reikšmės vertė (vertinama 0-
- Page 81 and 82: 1 pav. Palankios dienos A. dauci in
- Page 83 and 84: Aptarimas. Palankios sąlygos Alter
- Page 85: SODININKYSTĖ IR DARŽININKYSTĖ. S
- Page 88 and 89: - RezultataiTrumpai išdėstomi tyr
- Page 90 and 91: Straipsnis knygoje:1. Streif J. 199
- Page 92 and 93: easons of the study, innovation. Sh
- Page 94 and 95: Article in book:1. Streif J. 1996.
- Page 96: ISSN 0236-4212Mokslinis leidinysLie