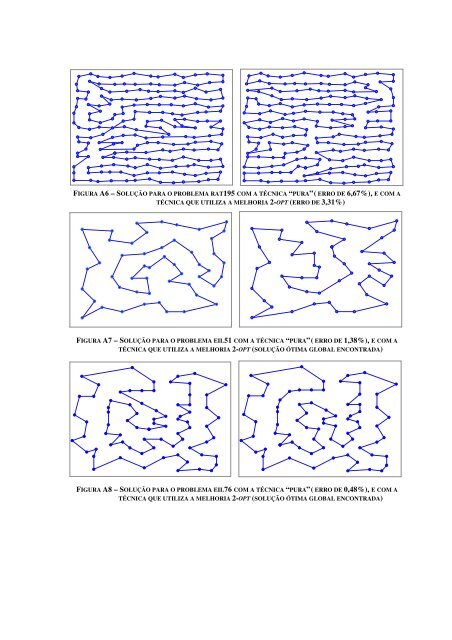
FIGURA A6 – SOLUÇÃO PARA O PROBLEMA RAT195 COM A TÉCNICA “ PURA” ( ERRO DE 6,67%), E COM A TÉCNICA QUE UTILIZA A MELHORIA 2-OPT (ERRO DE 3,31%) FIGURA A7 – SOLUÇÃO PARA O PROBLEMA EIL51 COM A TÉCNICA “ PURA” ( ERRO DE 1,38%), E COM A TÉCNICA QUE UTILIZA A MELHORIA 2-OPT (SOLUÇÃO ÓTIMA GLOBAL ENCONTRADA) FIGURA A8 – SOLUÇÃO PARA O PROBLEMA EIL76 COM A TÉCNICA “ PURA” ( ERRO DE 0,48%), E COM A TÉCNICA QUE UTILIZA A MELHORIA 2-OPT (SOLUÇÃO ÓTIMA GLOBAL ENCONTRADA)
REFERÊNCIAS AFFENZELLER, M.; WANGER, S., A Self-Adaptive Model for Selective Pressure Handling within the Theory of Genetic Algorithms. In: Computer Aided Systems Theory, 2003, Las Palmas de Gran Ca<strong>na</strong>ria, Spain: Proceedings of Computer Aided Systems Theory - EUROCAST 2003, Springer Verlag: Lecture Notes in Computer Science, v. 2809, n. 1, p. 384-393. AHUJA, R.K.; MANGNANTI, T.L.; ORLIN, J.B., Network Flows: Theory, Algorithms and Applications. New Jersey: Prentice Hall, 1993. ARAS, N.; OOMMEN, B.J.; ALTINEL, I.K., The Kohonen network incorporating explicit statistics and its application to the traveling salesman problem. Neural Networks, v. 12, n. 9, p. 1273-1284, nov. 1999. AUFFERMANN, W.F.; NGAN, S.C.; HU, X., Cluster significance testing using the Bootstrap. NeuroImage, v. 17, n. 2, p. 583-591, out. 2002. BAZARAA, M.S.; JARVIS, J.J.; SHERALI, H.D., Linear Programming and Network Flows. 2 nd ed. New York: Wiley, 1990. BECCALI, M.; CELLURA, M.; LO BRANO, V.; MARVUGLIA, A., Forecasting daily urban electric load profiles using Artificial Neural Networks. Energy Conversion and Ma<strong>na</strong>gement, v. 45, n. 18-19, p. 2879-2900, nov. 2004. BELTZER, A.I.; SATO, T., Neural classification of finite elements. Computers and Structures, v. 81, n. 24-25, p. 2331-2335, set. 2003. BIANCHI, L.; KNOWLES, J.; BOWLER, J., Local search for the probabilistic traveling salesman problem: Correction to the 2-p-opt and 1-shift algorithms. European Jour<strong>na</strong>l of Operatio<strong>na</strong>l Research, v. 162, n. 1, p. 206-219, abr. 2005. BONABEAU, E.; HÉNAUX, F., Self organizing maps for drawing large graphs. Information Processing Letters, v. 67, n. 4, p. 177-184, ago. 1998. BROSSE, S.; GIRAUDEL, J.L.; LEK, S. Utilization of non-supervisioned neural networks and principal component a<strong>na</strong>lysis to study fish assemblages. Ecological Modelling, v. 146, n. 1-3, p. 159-166, dez. 2001.
- Page 1 and 2:
PAULO HENRIQUE SIQUEIRA UMA NOVA AB
- Page 3 and 4:
TERMO DE APROVAÇÃO PAULO HENRIQUE
- Page 5 and 6:
AGRADECIMENTOS À minha família, e
- Page 7 and 8:
SUMÁRIO 1 INTRODUÇÃO............
- Page 9 and 10:
LISTA DE FIGURAS FIGURA 1.1 - O PRO
- Page 11 and 12:
FIGURA A2 - SOLUÇÃO PARA O PROBLE
- Page 13 and 14:
RESUMO Neste trabalho são apresent
- Page 15 and 16:
1 INTRODUÇÃO 1.1 DESCRIÇÕES DOS
- Page 17 and 18:
dispersão entre os elementos da ma
- Page 19 and 20:
ALTINEL, 1999, BUDINICH, 1996, COCH
- Page 21 and 22:
penalidades similares quando os cus
- Page 23 and 24:
2 REVISÃO DA LITERATURA 2.1 INTROD
- Page 25 and 26:
O trabalho de Haken, Schanz e Stark
- Page 27 and 28:
computacional bem inferior em compa
- Page 29 and 30:
Em Wu e Chow (2004) uma nova técni
- Page 31 and 32:
garantir a convergência da rede pa
- Page 33 and 34:
Aleatória (Random Insertion heuris
- Page 35 and 36:
A publicação de Liu et al. (2003)
- Page 37 and 38:
Jin et al. (2003) mostra a aplicaç
- Page 39 and 40:
CAPÍTULO III 3 RESOLUÇÃO DO PROB
- Page 41 and 42:
definido no próximo Capítulo dest
- Page 43 and 44:
aos estímulos recebidos dos sensor
- Page 45 and 46:
Passo 3: Determine o neurônio i qu
- Page 47 and 48:
E MQ 1 = v v ∑ k= 1 p k − w * 2
- Page 49 and 50:
neurônio vencedor em mapas distint
- Page 51 and 52:
FIGURA 3.5 - EXEMPLO DA REPRESENTA
- Page 53 and 54:
grupo 4 grupo 1 grupo 2 grupo 3 gru
- Page 55 and 56: ..., x1n, x21, x22, ..., x2n, ...,
- Page 57 and 58: ⎛ 0 0 0 0 0 0 1 0⎞ ⎜ ⎟ ⎜
- Page 59 and 60: ⎛0 0 0 0 1 0 0 0⎞ ⎜ ⎟ ⎜0
- Page 61 and 62: Passo 4: Se m ≤ n, então faça m
- Page 63 and 64: ⎛ 0 0 0 0 0 0 0, 9992 0 ⎞ ⎜
- Page 65 and 66: Quando o ajuste Winner Takes All é
- Page 67 and 68: 4 ESTUDO DE CASO 4.1 DESCRIÇÃO DO
- Page 69 and 70: Passo 3: Aplique o modelo da Design
- Page 71 and 72: terceira coordenada do vetor de ent
- Page 73 and 74: CAPÍTULO V 5 ANÁLISES DE RESULTAD
- Page 75 and 76: sempre acima de 78%, o que mostra q
- Page 77 and 78: Por exemplo, o agrupamento 9 repres
- Page 79 and 80: mostra a Figura 5.3. Os mapas com d
- Page 81 and 82: Erro médio 40% 35% 30% 25% 20% 15%
- Page 83 and 84: partir da solução inicial, encont
- Page 85 and 86: Algoritmo baseado no princípio Win
- Page 87 and 88: ⎛ 0 ⎜ ⎜ 0 ⎜ 0 ⎜ ⎜ 0 ⎜
- Page 89 and 90: 10 8 6 4 2 0 1 10 2 3 8 9 7 0 3 6 9
- Page 91 and 92: TABELA 6.2 - PROBLEMAS ASSIMÉTRICO
- Page 93 and 94: TABELA 6.4 - RESULTADOS DOS EXPERIM
- Page 95 and 96: FIGURA 6.5 - RESULTADOS DO PROBLEMA
- Page 97 and 98: 16% 14% 12% 10% TABELA 6.6 - RESULT
- Page 99 and 100: erro médio FIGURA 6.8 - QUALIDADE
- Page 101 and 102: CAPÍTULO VII 7 CONCLUSÕES E TRABA
- Page 103 and 104: problema) em outros problemas reais
- Page 105: FIGURA A3 - SOLUÇÃO PARA O PROBLE
- Page 109 and 110: DORIGO, M.; GARAMBARDELLA, L.M., An
- Page 111 and 112: KIVILUOTO, K., Topology Preservatio
- Page 113 and 114: ONWUBOLU, G.C.; CLERC, M., Optimal
- Page 115 and 116: VIEIRA, F.C.; DORIA NETO, A.D.; COS