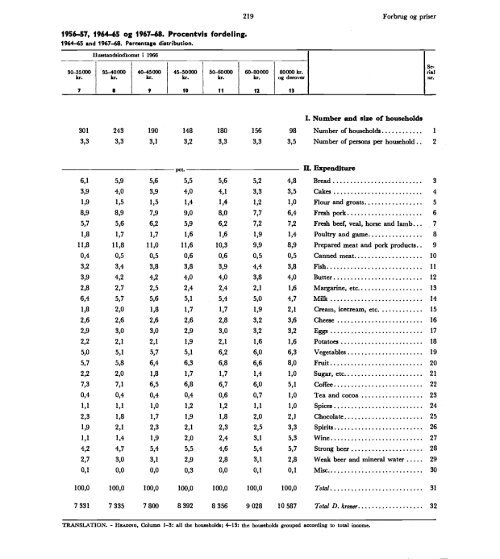
1956-57, 1964-65 og 1967-68. Procentvls fordeling. 1964.-65 and 1967-68. Percentage distribution. Hustandindkomst i 1966 219 Forbrug og priser Se- 30-35000 kr. 35-40000 kr. 40-45000 kr. 45-50000 kr. 50-60000 kr. 60-80000 kr. 80000 ltr. og derover rial nr. 7 s 9 10 11 12 13 I. Number and size of households 301 243 190 148 180 156 98 Number of households 3,3 3,3 3,1 3,2 3,3 3,3 3,5 Number of persons per household 2 pct. II. Expenditure 6,1 5,9 5,6 5,5 5,6 5,2 4,8 Bread 3 3,9 4,0 3,9 4,0 4,1 3,3 3,5 Cakes 4 1,9 1,5 1,5 1,4 1,4 1,2 1,0 Flour and groats 5 8,9 8,9 7,9 9,0 8,0 7,7 6,4 Fresh pork 6 5,7 5,6 6,2 5,9 6,2 7,2 7,2 Fresh beef, veal, horse and lamb 7 1,8 1,7 1,7 1,6 1,6 1,9 1,4 Poultry and game 8 11,8 11,8 11,0 11,6 10,3 9,9 8,9 Prepared meat and pork products 9 0,4 0,5 0,5 0,6 0,6 0,5 0,5 Canned meat 10 3,2 3,4 3,8 3,8 3,9 4,4 3,8 Fish 11 3,9 4,2 4,2 4,0 4,0 3,8 4,0 Butter 12 2,8 2,7 2,5 2,4 2,4 2,1 1,6 Margarine, etc. 13 6,4 5,7 5,6 5,1 5,4 5,0 4,7 Milk 14 1,8 2,0 1,8 1,7 1,7 1,9 2,1 Cream, icecream, etc. 15 2,6 2,6 2,6 2,6 2,8 3,2 3,6 Cheese 16 2,9 3,0 3,0 2,9 3,0 3,2 3,2 Eggs 17 2,2 2,1 2,1 1,9 2,1 1,6 1,6 Potatoes 18 5,0 5,1 5,7 5,1 6,2 6,0 6,3 Vegetables 19 5,7 5,8 6,4 6,3 6,8 6,6 8,0 Fruit 20 2,2 2,0 1,8 1,7 1,7 1,4 1,0 Sugar, etc 21 7,3 7,1 6,5 6,8 6,7 6,0 5,1 Coffee 22 0,4 0,4 0,4 0,4 0,6 0,7 1,0 Tea and cocoa 23 1,1 1,1 1,0 1,2 1,2 1,1 1,0 Spices 24 2,3 1,8 1,7 1,9 1,8 2,0 2,1 Chocolate 25 1,9 2,1 2,3 2,1 2,3 2,5 3,3 Spirits 26 1,1 1,4 1,9 2,0 2,4 3,1 5,3 Wine 27 4,2 4,7 5,4 5,5 4,6 5,4 5,7 Strong beer 28 2,7 3,0 3,1 2,9 2,8 3,1 2,8 Weak beer and mineral water 29 0,1 0,0 0,0 0,3 0,0 0,1 0,1 Misc. 30 100,0 100,0 100,0 100,0 100,0 100,0 100,0 Total 31 7 331 7 335 7800 8 392 8 356 9028 10 587 Total D. kroner 32 TRANSLATION. - HEADSNO, Column 1-3: all the householde; 4-13: the households grouped according to total income.
220 Tabel 185. Udgifter til indkøbte føde- og drikkevarer for Iønmodtagerhusstande i regnskabsåret Expenditure on food and beverages bought by various types of wage and salary earners in the financial year Februar 1967-januar 1968 Løbe nr. Arbejdere Funktionærer og tjenestemænd Samtlige lønmodtagere Enlig mand Enlig kvinde 2 3 4 s L Husstandsstørrelse og -sammensætning I Antal husstande i undersøgelsen 847 988 1 835 32 118 2 Heraf arbejderhusstande 847 - 847 15 29 3 Antal personer pr. husstand 3,2 3,2 3,1 1 1 U. Udgifter til: pct. 4 Brød 6,0 5,5 5,8 4,9 5,3 5 Kager 3,8 4,0 3,9 3,2 3,9 6 Mel og gryn 1,8 1,4 1,6 0,7 0,9 7 Fersk flæsk og svinekød 9,2 7,3 8,4 5,0 7,7 8 Fersk okse-, kalve-, heste- og lammekod 5,8 6,1 6,0 6,0 5,0 9 Fjerkræ og vildt 1,8 1,5 1,7 1,7 1,9 10 Tilberedte kød- og flæskevarer 12,1 10,3 11,4 10,9 9,7 11 Kødkonserves 0,5 0,6 0,5 0,9 0,9 12 Fisk 3,3 3,8 3,5 4,5 3,1 13 Smør 4,0 4,2 4,1 3,3 4,7 14 Margarine m.v. 2,9 2,3 2,6 1,7 1,8 15 Mælk 6,0 5,5 5,8 3,1 3,6 16 Fløde, flødeis o.l. 1,8 2,0 1,9 0,9 2,3 17 Ost 2,6 3,0 2,8 2,8 3,6 18 Æg 2,9 3,2 3,0 2,6 3,0 19 Kartofler 2,3 1,8 2,1 1,5 1,6 20 Grønsager 4,9 5,9 5,3 4,9 6,9 21 Frugt 5,5 7,1 6,2 4,5 9,0 22 Sukker m.v 2,3 1,7 2,0 1,1 1,3 23 Kaffe 7,6 6,3 7,0 5,7 7,9 24 The og kakao 0,4 0,6 0,5 0,7 0,8 25 Krydderier 1,1 1,2 1,1 0,8 1,2 26 Chokolade 1,9 1,9 1,9 1,4 1,4 27 Spiritus 1,5 2,5 1,9 5,5 2,1 28 Vine 0,9 2,8 1,7 7,4 3,4 29 Stærkt ø1 4,3 4,9 4,6 11,0 4,5 30 Lyst øl, vand 3,1 2,8 2,9 3,3 2,5 31 Diverse 0,0 0,1 0,1 0,0 0,0 32 Ialt 100,0 100,0 100,0 100,0 100,0 33 I alt kr. pr. husstand 7 244 7 559 7 376 4 168 3 710 Am,. Se anmærkning til tabel 184. KILDE: Stat. Efterr. 1968, nr. 58. TRANSLATION. - Routo, Column 1-3: households grouped according to status of the household head; 1: workers; 2: public servants and salaried
- Page 1 and 2:
Danmarks Statistik STATISTISK ÅRBO
- Page 3 and 4:
Forord I Statistisk Arbog er optage
- Page 5 and 6:
Table TABLE OF CONTENTS 1-3 75 Denm
- Page 7 and 8:
2 Tabet 2. Den administrative indde
- Page 9 and 10:
Tabel 3. (s. 3-5) Meteorologiske fo
- Page 11 and 12:
Tabel 4. By- og landbefoiknlngen I
- Page 13 and 14:
Tabel 7. (s. 8-12) E E.. Befolkning
- Page 15 and 16:
10 Tabel 7. Befolkningen I Hovedsta
- Page 17 and 18:
12 Tabel 7. Befolkningen i Hovedsta
- Page 19 and 20:
Tabel 8. Folketallet I de enkelte k
- Page 21 and 22:
16 Tabel 9. (s. 16-18) Handelsområ
- Page 23 and 24:
18 Areal og befoikninl Tabel 9. (s.
- Page 25 and 26:
Tabel 11. Befolkningen i de enkelte
- Page 27 and 28:
Tabel 12. Private husstande efter s
- Page 29 and 30:
Tabel 16. 24 Børn i private hussta
- Page 31 and 32:
26 Tabel 18. Befolkningen på 14 å
- Page 33 and 34:
Tabel 19. B. Heraf midlertidigt ikk
- Page 35 and 36:
Tabet 21. Befolkningens fordeling p
- Page 37 and 38:
Tabel 21. Befolkningens fordeling p
- Page 39 and 40:
Tabel 21. Befolkningens fordeling p
- Page 41 and 42:
Tabel 21. Befolkningens fordeling p
- Page 43 and 44:
38 Tabel 22. BefolknIngens fordelin
- Page 45 and 46:
Tabel 24. Folketal i visse alderskl
- Page 47 and 48:
Tabel 26. Fødte og døde, fordelt
- Page 49 and 50:
44 Tabel 31. Antal levendefødte b
- Page 51 and 52:
Tabel 35. Dødelighedstavle, beregn
- Page 53 and 54:
48 Tabel 38. Sessionsresultaterne o
- Page 55 and 56:
50 Tabel 40. Dødsårsagerne 1970.
- Page 57 and 58:
Tabd 43. Medidnalpersonalet 1969. M
- Page 59 and 60:
Tabel 46. Lejligheder fordelt efter
- Page 61 and 62:
Tabel 48. LeJligheder fordelt efter
- Page 63 and 64:
58 Tabel 50. Sikringsrum (private b
- Page 65 and 66:
60 Tabel 53. Det fuidforte byggeri
- Page 67 and 68:
62 Tabel 56. Omvurdering af faste e
- Page 69 and 70:
64 Tabel 58. Ejendomsvurderingen pr
- Page 71 and 72:
Tab& Tabel 58. 66 Ejendomsvurdering
- Page 73 and 74:
Tabel 61. Omsætning af bebyggede l
- Page 75 and 76:
70 Tabel 65. Omsætning af beboelse
- Page 77 and 78:
Tabel 69. Antal landbrugsejendomme
- Page 79 and 80:
Tabel 73. Areal med frø. Seed area
- Page 81 and 82:
Tab& 75. Løbe- nr. Høsten på lan
- Page 83 and 84:
TRANSLATION. - Hansao, HEADING, Col
- Page 85 and 86:
80 Tabel 81. Landbrugets medhjælp
- Page 87 and 88:
Tabel 84. Forbrug af handelsgødnin
- Page 89 and 90:
Tabel 88. Mængdeindeks Mængdelnde
- Page 91 and 92:
Tabef 90. (s. 85-86) I driftsårene
- Page 93 and 94:
88 Tabel 92. (s. 88-89) Noteringer
- Page 95 and 96:
90 Tabei 94. Bruttolnvesteringer I
- Page 97 and 98:
Tabel 96. 92 Antal ejendomme og are
- Page 99 and 100:
94 Tabel 99. Mængde- og prisindeks
- Page 101 and 102:
96 Tabet 102. Skove og plantager 19
- Page 103 and 104:
98 Tabel 104. Saltvandsfiskeriet. S
- Page 105 and 106:
100 Tabel 107. Regnskabsoplysnlnger
- Page 107 and 108:
102 Tabel 108. BeskæftIgede Beskæ
- Page 109 and 110:
104 Tabel 110. Industriens arbejdsk
- Page 111 and 112:
106 Tabel 112. De enkelte industrih
- Page 113 and 114:
i 108 Tabel 113. Industriens salg a
- Page 115 and 116:
110 Industriens salg af vigtige var
- Page 117 and 118:
Tabel 113. (a. (s. 107-119) 112 Ind
- Page 119 and 120:
Tabel 113. (s. 107-119) Under BTN p
- Page 121 and 122:
Tabel 113. Industriens salg af vigt
- Page 123 and 124:
118 Tabel 113. Industriens salg af
- Page 125 and 126:
120 Tabel 114. Industriens omsætni
- Page 127 and 128:
122 Tabel 116. Industriens invester
- Page 129 and 130:
124 Tabel 118. Lagerbeholdninger af
- Page 131 and 132:
126 Tabet 119. Gasværker. Gas-work
- Page 133 and 134:
128 Tabel 122. Omsætning og køb I
- Page 135 and 136:
130 Tabel 123 (s. 129-130) Detailha
- Page 137 and 138:
Tabel 125. (s. 132-133) (s. 132-133
- Page 139 and 140:
134 Tabel 126. Regnskabsstatistik f
- Page 141 and 142:
Tabel 127. Regnskabsoplysnlnger Reg
- Page 143 and 144:
138 Tabel 130. Patentvæsenet. Pate
- Page 145 and 146:
Tabel 134. (s. 140-143) l40143) 140
- Page 147 and 148:
Tabel 134. (s. 140-143) (s. 140-143
- Page 149 and 150:
144 Tabel 135. Vareomsætningen mel
- Page 151 and 152:
146 Tabet Tab& 135. Vareomsætninge
- Page 153 and 154:
148 Tabel 135. Vareomsætningen mel
- Page 155 and 156:
150 Tabel 135. Vareomsætningen mel
- Page 157 and 158:
152 Tabel 135. Vareomsætningen mel
- Page 159 and 160:
154 Tabel 135. Vareomsætningen mel
- Page 161 and 162:
156 Tabel 135. Vareomsætningen mel
- Page 163 and 164:
Tabel 135. Vareomsætningen mellem
- Page 165 and 166:
160 Tabel 135. Vareomsætningen mel
- Page 167 and 168:
162 Tab& Tabel 135. Vareomsætninge
- Page 169 and 170:
164 Tabet 135. Vareomsætningen mel
- Page 171 and 172:
166 Tabel 135. Vareomsætnlngen mel
- Page 173 and 174: TabeT 135. Vareomsætningen mellem
- Page 175 and 176: 170 Tabel 136. (s. 170-173) Udførs
- Page 177 and 178: Tabel 136. (s. 170.-173) (s. 170-17
- Page 179 and 180: 174 Tabel 137. Kvantumindeks og ind
- Page 181 and 182: 176 Tabel 137. Kvantumindeks og ind
- Page 183 and 184: 178 Tabel 138. Indeks for enhedsvæ
- Page 185 and 186: 180 Tabel 142. SkIbsfarten mellem D
- Page 187 and 188: 182 Tabel 145. Godsomsætningen God
- Page 189 and 190: 184 Tabel 146. (s. 183-187) Skibsfa
- Page 191 and 192: 186 Tabel 146. Skibsfarten på do e
- Page 193 and 194: Tabel 147. Antal skibspassager sklb
- Page 195 and 196: 190 Tabel 152. Motorparken pr. 31.d
- Page 197 and 198: 192 Tabel 153. (s. 191-192) Heraf 3
- Page 199 and 200: Bøjden- 194 Tabel 158. Bil- og pas
- Page 201 and 202: Tabel 161. Godstransporten til og f
- Page 203 and 204: Tabel 163. Dræbte og tilskadekomne
- Page 205 and 206: 200 Tabel 166. Lufttrafik på Købe
- Page 207 and 208: Tabel 170. Persontrafik mellem Danm
- Page 209 and 210: 204 Tabel 172. Antal hoteller m.v.
- Page 211 and 212: 206 Tabet Tabel 176. Telefonvæsene
- Page 213 and 214: 208 Tabel 177. Post- og telegrafvæ
- Page 215 and 216: Tabel 178. (s. 208-210) Danmarks Ra
- Page 217 and 218: Tabel 180. (s. 212-213) 212 Forbrug
- Page 219 and 220: 214 Tabel 182. Lønmodtagerhusstand
- Page 221 and 222: 216 Tabel 183. Udgifter, opsparing
- Page 223: 218 Tabel 184. Udgifter til indkøb
- Page 227 and 228: Tabel 186. Engrosprisindeks for for
- Page 229 and 230: Tabel 186. Engrosprisindeks for for
- Page 231 and 232: Tabel 187. Engrosprisindeks på hov
- Page 233 and 234: I I I Tabel 190. Forbrugerprisindek
- Page 235 and 236: I 230 Tabel 192. Forbrugerprisindek
- Page 237 and 238: 232 Tabel 194. Råvareprisindeks 19
- Page 239 and 240: 234 Tab& 197. Byggeomkostninger og
- Page 241 and 242: 236 Tabel 200. Betalingsbalancen ov
- Page 243 and 244: 238 Tabel 202. Danmarks kapitalbala
- Page 245 and 246: Tabel 205. 240 Danmarks Nationalban
- Page 247 and 248: 242 Tabel 210. Danmarks Natlonalban
- Page 249 and 250: 244 Tabel 211. Danmarks Nationalban
- Page 251 and 252: Bankerne på Færøerne er ikke med
- Page 253 and 254: Tabel 213. Sparekasserne 1970/71, f
- Page 255 and 256: Tabel 214. Kredit- og hypotekforeni
- Page 257 and 258: 252 Tabel 214. Kredit- og hypotekfo
- Page 259 and 260: 254 Tab& Tabet 215. Kongeriget Danm
- Page 261 and 262: 256 Tabel 21 6. Reallånefondenes R
- Page 263 and 264: Tabel 219. Kongeriget Danmarks Mske
- Page 265 and 266: 11,11 12,04 260 Tabel 223. N NatIon
- Page 267 and 268: 262 Tabel 226. Københavns børskur
- Page 269 and 270: 264 Tabel 229. Aktieselskabernes Ak
- Page 271 and 272: 266 Tabel 230. Bevægelsen i akties
- Page 273 and 274: 268 Tabel 232. Andelskasserne. Co-o
- Page 275 and 276:
Tabel 233. De her i landet virkende
- Page 277 and 278:
272 Tabel 235. Forsikringssummer m.
- Page 279 and 280:
274 Tabel 237. De danske forsikring
- Page 281 and 282:
Tabel 240. 276 Antal indgåede og b
- Page 283 and 284:
278 Tabel 242. Den lovpligtige ulyk
- Page 285 and 286:
Tabel 245. 280 Daginstitutioner sam
- Page 287 and 288:
282 Tabel 246. Børne- og ungdomsv
- Page 289 and 290:
Tabet 248. Offentlig forsorg m.v. 1
- Page 291 and 292:
II. Medlemstal (Pr. 31. dec.)2 Nyde
- Page 293 and 294:
288 Tabel 255. Invalidepensionister
- Page 295 and 296:
290 Tabel 257. Folkepensionen 1969/
- Page 297 and 298:
Tabel 260. Boligsikring til familie
- Page 299 and 300:
294 Tabe! 265 I. S. I. C. Arbejdsfo
- Page 301 and 302:
296 Tabel 266. Arbejdsformidlingsvi
- Page 303 and 304:
298 Tabel 269. Arbejdslønnen (indu
- Page 305 and 306:
Tabel 273. Lønstatistik for slagte
- Page 307 and 308:
Tabel 276. Arbejdsiønnen i forskel
- Page 309 and 310:
304 Tabel 278. Påbegyndte og afbru
- Page 311 and 312:
306 Tabel 280. Arbejdsløsheden ind
- Page 313 and 314:
308 Tabel 281. (s. 308-311) Arbejds
- Page 315 and 316:
Tabel 281. (s. 308-311) Løbe nr. 3
- Page 317 and 318:
312 Tabel 282. Arbejdsløsheden Ind
- Page 319 and 320:
314 Tabel 284. Løbenr. Antal ledig
- Page 321 and 322:
Tabel 286. (s. 315-316) 316 Hovedor
- Page 323 and 324:
318 Tab& 288. (s. 318-321) Straffer
- Page 325 and 326:
320 Tabel 288. (s.318_321) Straffer
- Page 327 and 328:
322 Tabel 289. (s.321-323) Den borg
- Page 329 and 330:
324 Tabel 290. Tiltalefrafald 1970.
- Page 331 and 332:
326 Tabel 293. (s. 326-331) Elever
- Page 333 and 334:
328 Tabel 293. (s. 326-351) Elever
- Page 335 and 336:
330 Tabel 293. (s. 326.331) Elever
- Page 337 and 338:
Tabel 294. Antallet af lærere ved
- Page 339 and 340:
Tabe! 298. Antal elever i børnesko
- Page 341 and 342:
Tabel 300. Løbe rir. 336 Udgiftern
- Page 343 and 344:
338 Tabel 301. Private efterskoler,
- Page 345 and 346:
340 Tabel O5. Dagblade og kontrolle
- Page 347 and 348:
342 Tabel 308. Udkomne bøger 1970
- Page 349 and 350:
344 Tabel 309. Folketlngsvalgene. T
- Page 351 and 352:
346 Tabel 310. Folketingsvalget den
- Page 353 and 354:
348 Tabel 310. Folketingsvatget den
- Page 355 and 356:
350 Tabel 310. Folketingsvalget den
- Page 357 and 358:
Tabel 311. Folkeafstemningen om vai
- Page 359 and 360:
Tabel 313, Valgene til de kommunale
- Page 361 and 362:
Tabel 313. Valgene til by- og sogne
- Page 363 and 364:
358 Tabel 313. Valgene til de kommu
- Page 365 and 366:
360 Tabel 315. Statens og kommunern
- Page 367 and 368:
362 Tabel 316. Sam'et Samlet oversi
- Page 369 and 370:
364 Tabel 317. Speciflceret oversig
- Page 371 and 372:
366 Tabel 317. Speclficeret oversig
- Page 373 and 374:
368 Tabel 317. Speclficaret oversig
- Page 375 and 376:
370 Tabel 317. Specificeret oversig
- Page 377 and 378:
372 Tabel 317. Speclficeret oversig
- Page 379 and 380:
'374 Tabel 317. Specificeret oversi
- Page 381 and 382:
376 Tabd Tab& 317. Specificeret ove
- Page 383 and 384:
378 Tabel 317. 3I7. Specificerat ov
- Page 385 and 386:
380 Tabel 319. Statens optagelse op
- Page 387 and 388:
Tabel 322. Den samlede danske stats
- Page 389 and 390:
384 Tabel 324. Årstal Statsig Stat
- Page 391 and 392:
386 Tabel 326. (s. 386-389) Oversig
- Page 393 and 394:
388 Tabel 326. (s. 386-389) OversIg
- Page 395 and 396:
390 Tabel 327. (s.390-39!) 390-391)
- Page 397 and 398:
Tabel 328. De enkelte provinsbyers
- Page 399 and 400:
Tabel 329. I. i Indtægter 394 Indt
- Page 401 and 402:
Tabel 331. Regnskaber for amtsfonde
- Page 403 and 404:
398 Tabel 332. Udgifter til bygge-
- Page 405 and 406:
Tabel 334. Låntagning i kommuner,
- Page 407 and 408:
402 Tabel 337. Statens og kommunern
- Page 409 and 410:
404 Tabel 340. Personbeskatningen i
- Page 411 and 412:
406 Tabe! 341. Ejendomsbeskatningen
- Page 413 and 414:
408 Tabel 342. Den samlede direkte
- Page 415 and 416:
Tabel 343. Kommunernes grundskyldsp
- Page 417 and 418:
Tabel 344. Kommunernes udskrivnings
- Page 419 and 420:
Tab& 344. Kommunernes udskrlvningsp
- Page 421 and 422:
Tabel 344. Kommunernes udskrivnings
- Page 423 and 424:
Tabel 346. De samlede selskabsskatt
- Page 425 and 426:
420 Tabel 349. Arveafglften i finan
- Page 427 and 428:
422 Tabel 352. Afgifter af motorkø
- Page 429 and 430:
424 Tabel 356. De indkomstansatte f
- Page 431 and 432:
J Tabel 358. 426 Indkomstansættels
- Page 433 and 434:
428 Tabel 361. Indkomstansætteiser
- Page 435 and 436:
Tabel 364. 430 Antal ansættelser,
- Page 437 and 438:
432 Tabel 365. Samlede ansatte indk
- Page 439 and 440:
434 Nationalregnskabstallene bygger
- Page 441 and 442:
436 Tabel 370. (s.436-437) Bruttofa
- Page 443 and 444:
Tabel 372. Konsumet. Consumption. 4
- Page 445 and 446:
440 Tabel 375. Bruttoopsparingen. G
- Page 447 and 448:
Tabet 378. 442 Befolkningens fordel
- Page 449 and 450:
Tabel 382. Anmeldte sygdomstllfæld
- Page 451 and 452:
Tabel 387. Færøernes vareindførs
- Page 453 and 454:
Tabel 388. (s. 447-449) 448 Udførs
- Page 455 and 456:
Tabel 390. RegIstrerede skibe på m
- Page 457 and 458:
452 Tabel 395. De større færøske
- Page 459 and 460:
Tabel 399. 454 Sammendrag af regnsk
- Page 461 and 462:
456 Tabel 404. Meteorologiske forho
- Page 463 and 464:
458 Tabel 406. Folkemængden. Popu'
- Page 465 and 466:
460 Tabel 409. Ægteskaber, fødte
- Page 467 and 468:
- Tabel 413. Anmeldte sygdomstllfæ
- Page 469 and 470:
464 Tabel 416 Erhvervstællingen i
- Page 471 and 472:
466 Tab& 418. Bestanden af de vigti
- Page 473 and 474:
Tabel 422. Grønlands vareindførse
- Page 475 and 476:
470 Tabel 423. (s. 469470) SITC (re
- Page 477 and 478:
Tabel 427. Tabel 428. Postbesørgel
- Page 479 and 480:
Tabel 432. Forbrugerprisindekset fo
- Page 481 and 482:
476 Tabel 436. Skolen i Grønland.
- Page 483 and 484:
Tabel 440. 478 Statens udgifter ved
- Page 485 and 486:
481 Internationale oversigter Tabel
- Page 487 and 488:
483 Internationale oversigtet Tabel
- Page 489 and 490:
Tab& 442. (s. 481-486) Areal og fol
- Page 491 and 492:
Tabel 443. Verdensdele og regioner
- Page 493 and 494:
489 Internationale oversigter Tabel
- Page 495 and 496:
491 Internationale oversigter Tabel
- Page 497 and 498:
493 Internationale oversigter Taoel
- Page 499 and 500:
495 Internationale oversigter Tabel
- Page 501 and 502:
497 Internationale oversigter Tabel
- Page 503 and 504:
499 Internationale oversigter Tab&
- Page 505 and 506:
501 Internationale oversigter I alt
- Page 507 and 508:
indbyggere i de enkelte a1dersklase
- Page 509 and 510:
505 Internationale oversigter indby
- Page 511 and 512:
507 Internationale oversigter Tabel
- Page 513 and 514:
Tabel 450. Mlddellevetiden. Lande
- Page 515 and 516:
511 Internationale oversigter areal
- Page 517 and 518:
513 Internationale oversigter Tabel
- Page 519 and 520:
515 Internationale oversigter Tabel
- Page 521 and 522:
Tabel 454. (. 514-524) Jordnedder N
- Page 523 and 524:
519 Internationale oversigter Tabel
- Page 525 and 526:
Tabel 454. (s. 514-524) Produktion
- Page 527 and 528:
523 Internationale oversigter Tabel
- Page 529 and 530:
525 Internationale oversigler Tabel
- Page 531 and 532:
527 Internationale oversigter Impor
- Page 533 and 534:
Tabel 459. (s. 529-538) Kød og fl
- Page 535 and 536:
Tab& 459. (. 529-538) Ungarn Vestty
- Page 537 and 538:
533 Internationale oversigter Tabel
- Page 539 and 540:
Tabet 459. (s. 529-538) Indførsel
- Page 541 and 542:
537 Internationale oversigter Tabel
- Page 543 and 544:
539 Internationale oversigter Tabel
- Page 545 and 546:
541 Internationale oversigter Tabel
- Page 547 and 548:
Tabel 465. Skibsfarten på udlandet
- Page 549 and 550:
545 Internationale oversigter Tabel
- Page 551 and 552:
Tabel 469. Automobiler i forskellig
- Page 553 and 554:
Tabel 471. Postvæsenet i forskelli
- Page 555 and 556:
Tabel 473. Betalingsbalancens løbe
- Page 557 and 558:
553 Internationale oversigter Tabel
- Page 559 and 560:
Tabel 478. Forbrugerprlsindeks i ud
- Page 561 and 562:
557 Internationale oversigter Tabel
- Page 563 and 564:
Tabel 484. NationaUndkomst I forske
- Page 565 and 566:
585 Index Cigars and cigarettes, pr
- Page 567 and 568:
587 Index Milk, production 83, 514
- Page 569 and 570:
DANMARKS STATISTIKS PUBLIKATIONER E
- Page 571 and 572:
563 Publikationsfortegnelse Boligt
- Page 573 and 574:
565 Publikationsfortegnelse Danmark
- Page 575 and 576:
FULDSTÆNDIG PUBLIKATIONSLISTE' En
- Page 577 and 578:
569 Publikationsfortegnelse Højdem
- Page 579 and 580:
Frugttræer og frugtbuske, Antal: S
- Page 581 and 582:
573 Publikationsfortegnelse 4,13,4;
- Page 583 and 584:
575 Publikationsfortegnelse Transpo
- Page 585 and 586:
Lønregulering efter pristallet, se
- Page 587 and 588:
579 Publikationsfortegnelse 4,92,1;
- Page 589 and 590:
581 Publikationsfortegnelse XV. For
- Page 591 and 592:
583 Publikationsbetegnelse 198. Man
- Page 593 and 594:
Omsætningsforhold mellem dansk og
- Page 595 and 596:
Arbejdstilladclser til udlændinge
- Page 597 and 598:
Cinders, forbrug 213 -' ind- og udh
- Page 599 and 600:
Folkeafstemning, om vaigretsalderen
- Page 601 and 602:
Havre, areal 73, 511 -, forsyning 7
- Page 603 and 604:
Keramiske produkter ind- og udførs
- Page 605 and 606:
Løn, i håndværk og industri 297-
- Page 607 and 608:
Papir, afgift 419 -, aktieselskaber
- Page 609 and 610:
Skorstensfèjere 36 Skotøj, se fod
- Page 611 and 612:
Tobak, udgifter 214-217 Tofamiliehu