From: on behalf of Panel Registry Subject: FW: TNG registration of ...
From: on behalf of Panel Registry Subject: FW: TNG registration of ...
From: on behalf of Panel Registry Subject: FW: TNG registration of ...

Create successful ePaper yourself
Turn your PDF publications into a flip-book with our unique Google optimized e-Paper software.
Source:<br />
Theo Mlynowski, UNBC<br />
Precipitati<strong>on</strong><br />
Similar to temperature, Mean Annual Precipitati<strong>on</strong> (MAP) – which c<strong>on</strong>cerns both rain and<br />
snow – is the average <strong>of</strong> wet and dry extremes measured every day throughout the course<br />
<strong>of</strong> a year. Figure 6 shows a general increase <strong>of</strong> MAP throughout the following periods: (a)<br />
1961 – 1990, (b) A1F1 2020’s, and (c) A1F1 2050’s.<br />
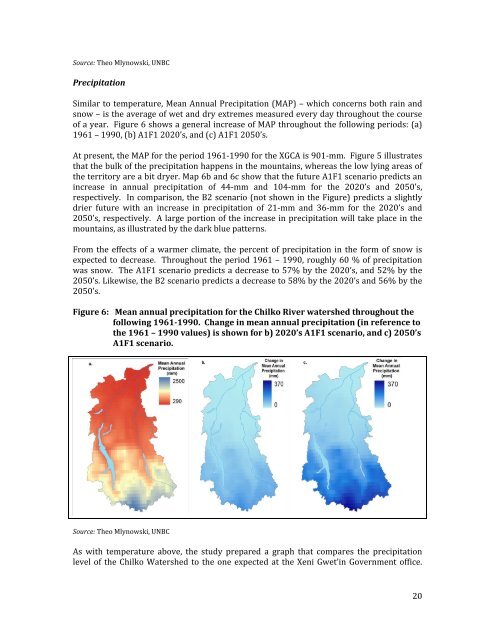
At present, the MAP for the period 1961‐1990 for the XGCA is 901‐mm. Figure 5 illustrates<br />
that the bulk <strong>of</strong> the precipitati<strong>on</strong> happens in the mountains, whereas the low lying areas <strong>of</strong><br />
the territory are a bit dryer. Map 6b and 6c show that the future A1F1 scenario predicts an<br />
increase in annual precipitati<strong>on</strong> <strong>of</strong> 44‐mm and 104‐mm for the 2020’s and 2050’s,<br />
respectively. In comparis<strong>on</strong>, the B2 scenario (not shown in the Figure) predicts a slightly<br />
drier future with an increase in precipitati<strong>on</strong> <strong>of</strong> 21‐mm and 36‐mm for the 2020’s and<br />
2050’s,<br />
respectively. A large porti<strong>on</strong> <strong>of</strong> the increase in precipitati<strong>on</strong> will take place in the<br />
mountains, as illustrated by the dark blue patterns.<br />
<str<strong>on</strong>g>From</str<strong>on</strong>g> the effects <strong>of</strong> a warmer climate, the percent <strong>of</strong> precipitati<strong>on</strong> in the form <strong>of</strong> snow is<br />
expected to decrease. Throughout the period 1961 – 1990, roughly 60 % <strong>of</strong> precipitati<strong>on</strong><br />
was snow. The A1F1 scenario predicts a decrease to 57% by the 2020’s, and 52% by the<br />
2050’s. Likewise, the B2 scenario predicts a decrease to 58% by the 2020’s and 56% by the<br />
2050’s.<br />
Figure 6: Mean annual precipitati<strong>on</strong> for the Chilko River watershed throughout the<br />
following 19611990. Change in mean annual precipitati<strong>on</strong> (in reference to<br />
the 1961 – 1990 values) is shown for b) 2020’s A1F1 scenario, and c) 2050’s<br />
A1F1 scenario.<br />
Source: Theo Mlynowski, UNBC<br />
As with temperature above, the study prepared a graph that compares the precipitati<strong>on</strong><br />
level <strong>of</strong> the Chilko Watershed to the <strong>on</strong>e expected at the Xeni Gwet’in Government <strong>of</strong>fice.<br />
20