annual financial statement 2011 - conwert Immobilien Invest SE
annual financial statement 2011 - conwert Immobilien Invest SE
annual financial statement 2011 - conwert Immobilien Invest SE

Create successful ePaper yourself
Turn your PDF publications into a flip-book with our unique Google optimized e-Paper software.
INTRO | MANAGEMENT REPORT |<br />
| FINANCIAL STATEMENTS<br />
CONSOLIDATED FINANCIAL STATEMENTS<br />
Notes<br />
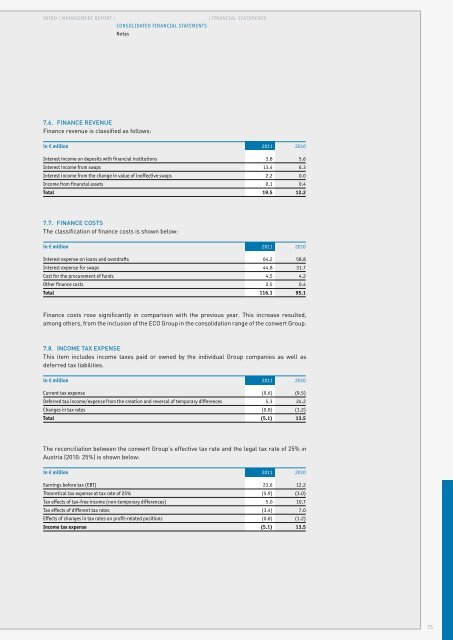
7.6. FINANCE REVENUE<br />
Finance revenue is classified as follows:<br />
in € million <strong>2011</strong> 2010<br />
Interest income on deposits with <strong>financial</strong> institutions 3.8 5.6<br />
Interest income from swaps 13.4 6.3<br />
Interest income from the change in value of ineffective swaps 2.2 0.0<br />
Income from <strong>financial</strong> assets 0.1 0.4<br />
Total 19.5 12.2<br />
7.7. FINANCE COSTS<br />
The classification of finance costs is shown below:<br />
in € million <strong>2011</strong> 2010<br />
Interest expense on loans and overdrafts 64.2 58.8<br />
Interest expense for swaps 44.8 31.7<br />
Cost for the procurement of funds 4.5 4.2<br />
Other finance costs 2.5 0.4<br />
Total 116.1 95.1<br />
Finance costs rose significantly in comparison with the previous year. This increase resulted,<br />
among others, from the inclusion of the ECO Group in the consolidation range of the <strong>conwert</strong> Group.<br />
7.8. INCOME TAX EXPEN<strong>SE</strong><br />
This item includes income taxes paid or owned by the individual Group companies as well as<br />
deferred tax liabilities.<br />
in € million <strong>2011</strong> 2010<br />
Current tax expense (9.6) (9.5)<br />
Deferred tax income/expense from the creation and reversal of temporary differences 5.3 24.2<br />
Changes in tax rates (0.8) (1.2)<br />
Total (5.1) 13.5<br />
The reconciliation between the <strong>conwert</strong> Group’s effective tax rate and the legal tax rate of 25% in<br />
Austria (2010: 25%) is shown below:<br />
in € million <strong>2011</strong> 2010<br />
Earnings before tax (EBT) 23.6 12.2<br />
Theoretical tax expense at tax rate of 25% (5.9) (3.0)<br />
Tax effects of tax-free income (non-temporary differences) 5.0 10.7<br />
Tax effects of different tax rates (3.4) 7.0<br />
Effects of changes in tax rates on profit-related positions (0.8) (1.2)<br />
Income tax expense (5.1) 13.5<br />
75