

Michelin couv courteGB
Michelin couv courteGB
Michelin couv courteGB

You also want an ePaper? Increase the reach of your titles
YUMPU automatically turns print PDFs into web optimized ePapers that Google loves.
Please refer to the section devoted to all factors impacting 2004<br />
accounts (description of switch to new accounting practices and<br />
reconciliation tables as between the two sets of accounting<br />
standards). This expands on the information that was published on<br />
January 20, 2005 in the course of a dedicated conference<br />
organized for the benefit of investors and financial analysts.<br />
Please note that the Group’s industrial and operational fundamentals<br />
are in no way altered by the switch to a new set of accounting<br />
standards whose main purpose is to deliver a standard measurement<br />
instrument in lieu of previously existing national accounting<br />
standards.<br />
Review of the key factors impacting switch<br />
to IFRS standards for <strong>Michelin</strong> Group<br />
(in € million)<br />
Statement of income<br />
Financial Year 2004<br />
French Gapp* IFRS Standards*<br />
Net Sales 15,689 15,048<br />
Operating Income 1,299<br />
Operating Margin<br />
Operating result **<br />
8.3%<br />
before non-recurring items<br />
Operating Margin<br />
- 1,303<br />
before non-recurring items 8.65%<br />
Operating result 1,239<br />
Operating Margin 8.2%<br />
Net Result<br />
Balance Sheet<br />
To December 31, 2004<br />
527 654<br />
Shareholder’s Funds 4,677 3,546<br />
Net debt 3,224 3,295<br />
Net debt /<br />
Shareholder’s Funds (“gearing”) 69% 93%<br />
*Audited.<br />
**Operating income has been stated after non-recurring items. For the sake of clarity and<br />
to facilitate an analysis of its accounts, <strong>Michelin</strong> has also decided to publish its operating<br />
income before non-recurring items.<br />
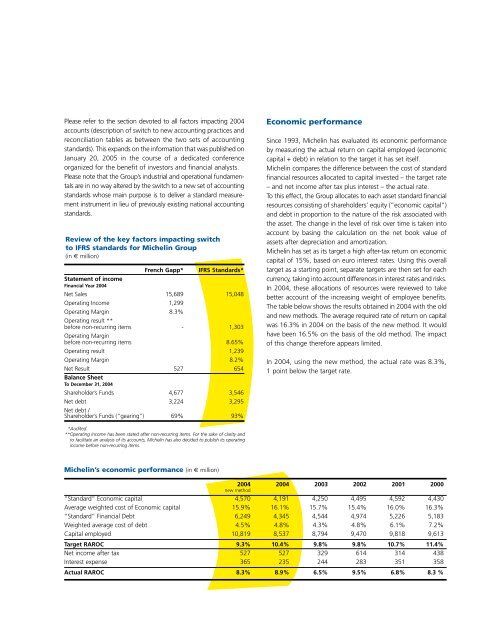
<strong>Michelin</strong>’s economic performance (in € million)<br />
Economic performance<br />
Since 1993, <strong>Michelin</strong> has evaluated its economic performance<br />
by measuring the actual return on capital employed (economic<br />
capital + debt) in relation to the target it has set itself.<br />
<strong>Michelin</strong> compares the difference between the cost of standard<br />
financial resources allocated to capital invested – the target rate<br />
– and net income after tax plus interest – the actual rate.<br />
To this effect, the Group allocates to each asset standard financial<br />
resources consisting of shareholders’ equity (“economic capital”)<br />
and debt in proportion to the nature of the risk associated with<br />
the asset. The change in the level of risk over time is taken into<br />
account by basing the calculation on the net book value of<br />
assets after depreciation and amortization.<br />
<strong>Michelin</strong> has set as its target a high after-tax return on economic<br />
capital of 15%, based on euro interest rates. Using this overall<br />
target as a starting point, separate targets are then set for each<br />
currency, taking into account differences in interest rates and risks.<br />
In 2004, these allocations of resources were reviewed to take<br />
better account of the increasing weight of employee benefits.<br />
The table below shows the results obtained in 2004 with the old<br />
and new methods. The average required rate of return on capital<br />
was 16.3% in 2004 on the basis of the new method. It would<br />
have been 16.5% on the basis of the old method. The impact<br />
of this change therefore appears limited.<br />
In 2004, using the new method, the actual rate was 8.3%,<br />
1 point below the target rate.<br />
2004 2004 2003 2002 2001 2000<br />
new method<br />
“Standard” Economic capital 4,570 4,191 4,250 4,495 4,592 4,430<br />
Average weighted cost of Economic capital 15.9% 16.1% 15.7% 15.4% 16.0% 16.3%<br />
“Standard” Financial Debt 6,249 4,345 4,544 4,974 5,226 5,183<br />
Weighted average cost of debt 4.5% 4.8% 4.3% 4.8% 6.1% 7.2%<br />
Capital employed 10,819 8,537 8,794 9,470 9,818 9,613<br />
Target RAROC 9.3% 10.4% 9.8% 9.8% 10.7% 11.4%<br />
Net income after tax 527 527 329 614 314 438<br />
Interest expense 365 235 244 283 351 358<br />
Actual RAROC 8.3% 8.9% 6.5% 9.5% 6.8% 8.3 %