

Michelin couv courteGB
Michelin couv courteGB
Michelin couv courteGB

Create successful ePaper yourself
Turn your PDF publications into a flip-book with our unique Google optimized e-Paper software.
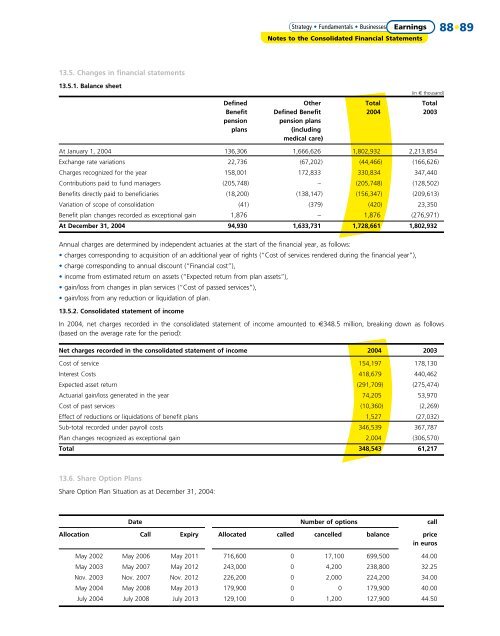
13.5. Changes in financial statements<br />
13.5.1. Balance sheet<br />
Strategy • Fundamentals • Businesses • Résultats Earnings<br />
Notes to the Consolidated Financial Statements<br />
(in € thousand)<br />
Defined Other Total Total<br />
Benefit Defined Benefit 2004 2003<br />
pension pension plans<br />
plans (including<br />
medical care)<br />
At January 1, 2004 136,306 1,666,626 1,802,932 2,213,854<br />
Exchange rate variations 22,736 (67,202) (44,466) (166,626)<br />
Charges recognized for the year 158,001 172,833 330,834 347,440<br />
Contributions paid to fund managers (205,748) – (205,748) (128,502)<br />
Benefits directly paid to beneficiaries (18,200) (138,147) (156,347) (209,613)<br />
Variation of scope of consolidation (41) (379) (420) 23,350<br />
Benefit plan changes recorded as exceptional gain 1,876 – 1,876 (276,971)<br />
At December 31, 2004 94,930 1,633,731 1,728,661 1,802,932<br />
Annual charges are determined by independent actuaries at the start of the financial year, as follows:<br />
• charges corresponding to acquisition of an additional year of rights (“Cost of services rendered during the financial year”),<br />
• charge corresponding to annual discount (“Financial cost”),<br />
• income from estimated return on assets (“Expected return from plan assets”),<br />
• gain/loss from changes in plan services (“Cost of passed services”),<br />
• gain/loss from any reduction or liquidation of plan.<br />
13.5.2. Consolidated statement of income<br />
In 2004, net charges recorded in the consolidated statement of income amounted to €348.5 million, breaking down as follows<br />
(based on the average rate for the period):<br />
Net charges recorded in the consolidated statement of income 2004 2003<br />
Cost of service 154,197 178,130<br />
Interest Costs 418,679 440,462<br />
Expected asset return (291,709) (275,474)<br />
Actuarial gain/loss generated in the year 74,205 53,970<br />
Cost of past services (10,360) (2,269)<br />
Effect of reductions or liquidations of benefit plans 1,527 (27,032)<br />
Sub-total recorded under payroll costs 346,539 367,787<br />
Plan changes recognized as exceptional gain 2,004 (306,570)<br />
Total 348,543 61,217<br />
13.6. Share Option Plans<br />
Share Option Plan Situation as at December 31, 2004:<br />
Date Number of options call<br />
Allocation Call Expiry Allocated called cancelled balance price<br />
in euros<br />
May 2002 May 2006 May 2011 716,600 0 17,100 699,500 44.00<br />
May 2003 May 2007 May 2012 243,000 0 4,200 238,800 32.25<br />
Nov. 2003 Nov. 2007 Nov. 2012 226,200 0 2,000 224,200 34.00<br />
May 2004 May 2008 May 2013 179,900 0 0 179,900 40.00<br />
July 2004 July 2008 July 2013 129,100 0 1,200 127,900 44.50<br />
88•89