

moleskine-ipo-report-04-03-2013-mediobanca
moleskine-ipo-report-04-03-2013-mediobanca
moleskine-ipo-report-04-03-2013-mediobanca

Create successful ePaper yourself
Turn your PDF publications into a flip-book with our unique Google optimized e-Paper software.
Moleskine<br />
MOLESKINE: Gross margin on adj. sales(09-12) (€m) MOLESKINE: purchasing costs (2009-12) (%)<br />
70<br />
60<br />
50<br />
40<br />
30<br />
20<br />
10<br />
0<br />
27.2<br />
66.7%<br />
38.2<br />
47.8<br />
71.6% 71.7%<br />
58.4<br />
2009 2010 2011 2012<br />
% Margin<br />
Source: Mediobanca Securities on company data<br />
74.8%<br />
300%<br />
250%<br />
200%<br />
150%<br />
100%<br />
50%<br />
0%<br />
THIS DOCUMENT MAY NOT BE DISTRIBUTED IN THE UNITED STATES, CANADA OR JAPAN.<br />
35%<br />
30%<br />
25%<br />
20%<br />
15%<br />
10%<br />
5%<br />
0%<br />
33%<br />
27%<br />
6%<br />
29% 29%<br />
25%<br />
4%<br />
27%<br />
25%<br />
23%<br />
2% 2%<br />
2009 2010 2011 2012<br />
Third party manufactoring costs Purchases of raw materials and finished products Purchasing costs/Revenues<br />
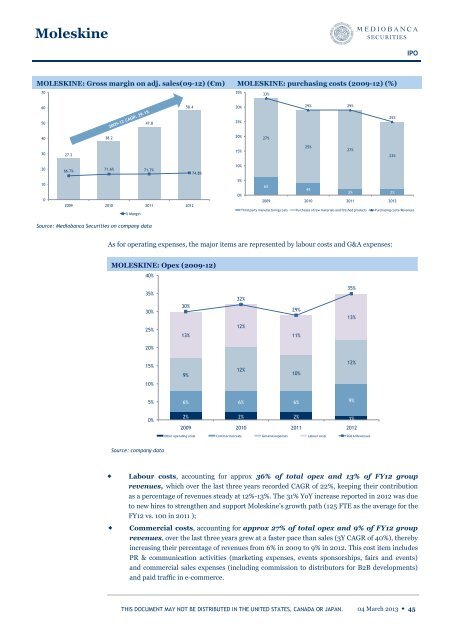
As for operating expenses, the major items are represented by labour costs and G&A expenses:<br />
MOLESKINE: Opex (2009-12)<br />
40%<br />
35%<br />
30%<br />
25%<br />
20%<br />
15%<br />
10%<br />
5%<br />
0%<br />
Source: company data<br />
30%<br />
13%<br />
9%<br />
32%<br />
12%<br />
12%<br />
6% 6% 6% 9%<br />
2% 2% 2% 1%<br />
2009 2010 2011 2012<br />
Other operating costs Commercial costs General expenses Labour costs SG&A/Revenues<br />
Labour costs, accounting for approx 36% of total opex and 13% of FY12 group<br />
revenues, which over the last three years recorded CAGR of 22%, keeping their contribution<br />
as a percentage of revenues steady at 12%-13%. The 31% YoY increase <strong>report</strong>ed in 2012 was due<br />
to new hires to strengthen and support Moleskine’s growth path (125 FTE as the average for the<br />
FY12 vs. 100 in 2011 );<br />
Commercial costs, accounting for approx 27% of total opex and 9% of FY12 group<br />
revenues, over the last three years grew at a faster pace than sales (3Y CAGR of 40%), thereby<br />
increasing their percentage of revenues from 6% in 2009 to 9% in 2012. This cost item includes<br />
PR & communication activities (marketing expenses, events sponsorships, fairs and events)<br />
and commercial sales expenses (including commission to distributors for B2B developments)<br />
and paid traffic in e-commerce.<br />
29%<br />
11%<br />
10%<br />
35%<br />
13%<br />
12%<br />
IPO<br />
<strong>04</strong> March <strong>2013</strong> ◆ 45