

moleskine-ipo-report-04-03-2013-mediobanca
moleskine-ipo-report-04-03-2013-mediobanca
moleskine-ipo-report-04-03-2013-mediobanca

Create successful ePaper yourself
Turn your PDF publications into a flip-book with our unique Google optimized e-Paper software.
Moleskine<br />
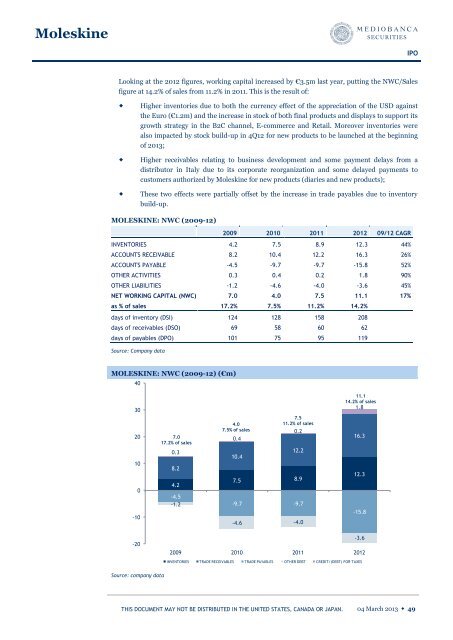
Looking at the 2012 figures, working capital increased by €3.5m last year, putting the NWC/Sales<br />
figure at 14.2% of sales from 11.2% in 2011. This is the result of:<br />
Higher inventories due to both the currency effect of the appreciation of the USD against<br />
the Euro (€1.2m) and the increase in stock of both final products and displays to support its<br />
growth strategy in the B2C channel, E-commerce and Retail. Moreover inventories were<br />
also impacted by stock build-up in 4Q12 for new products to be launched at the beginning<br />
of <strong>2013</strong>;<br />
Higher receivables relating to business development and some payment delays from a<br />
distributor in Italy due to its corporate reorganization and some delayed payments to<br />
customers authorized by Moleskine for new products (diaries and new products);<br />
These two effects were partially offset by the increase in trade payables due to inventory<br />
build-up.<br />
MOLESKINE: NWC (2009-12)<br />
2009 2010 2011 2012 09/12 CAGR<br />
INVENTORIES 4.2 7.5 8.9 12.3 44%<br />
ACCOUNTS RECEIVABLE 8.2 10.4 12.2 16.3 26%<br />
ACCOUNTS PAYABLE -4.5 -9.7 -9.7 -15.8 52%<br />
OTHER ACTIVITIES 0.3 0.4 0.2 1.8 90%<br />
OTHER LIABILITIES -1.2 -4.6 -4.0 -3.6 45%<br />
NET WORKING CAPITAL (NWC) 7.0 4.0 7.5 11.1 17%<br />
as % of sales 17.2% 7.5% 11.2% 14.2%<br />
days of inventory (DSI) 124 128 158 208<br />
days of receivables (DSO) 69 58 60 62<br />
days of payables (DPO) 101 75 95 119<br />
Source: Company data<br />
MOLESKINE: NWC (2009-12) (€m)<br />
40<br />
30<br />
20<br />
10<br />
0<br />
-10<br />
-20<br />
Source: company data<br />
7.0<br />
17.2% of sales<br />
0.3<br />
8.2<br />
4.2<br />
-4.5<br />
-1.2<br />
4.0<br />
7.5% of sales<br />
10.4<br />
THIS DOCUMENT MAY NOT BE DISTRIBUTED IN THE UNITED STATES, CANADA OR JAPAN.<br />
0.4<br />
7.5<br />
12.2<br />
8.9<br />
-9.7 -9.7<br />
-4.6<br />
7.5<br />
11.2% of sales<br />
0.2<br />
-4.0<br />
11.1<br />
14.2% of sales<br />
1.8<br />
16.3<br />
12.3<br />
-15.8<br />
-3.6<br />
2009 2010 2011 2012<br />
INVENTORIES TRADE RECEIVABLES TRADE PAYABLES OTHER DEBT CREDIT/(DEBT) FOR TAXES<br />
IPO<br />
<strong>04</strong> March <strong>2013</strong> ◆ 49