

moleskine-ipo-report-04-03-2013-mediobanca
moleskine-ipo-report-04-03-2013-mediobanca
moleskine-ipo-report-04-03-2013-mediobanca

Create successful ePaper yourself
Turn your PDF publications into a flip-book with our unique Google optimized e-Paper software.
Moleskine<br />
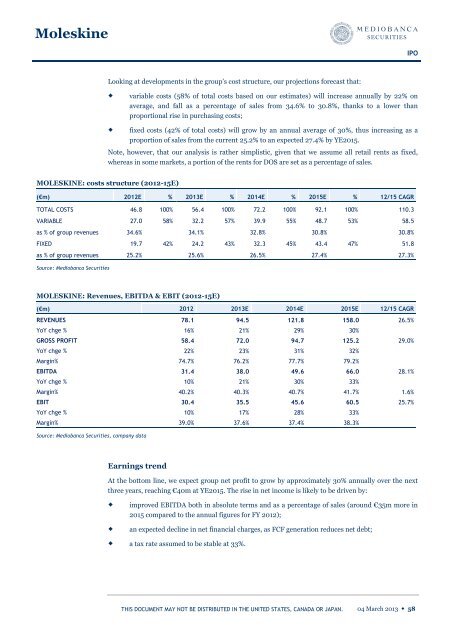
Looking at developments in the group’s cost structure, our projections forecast that:<br />
variable costs (58% of total costs based on our estimates) will increase annually by 22% on<br />
average, and fall as a percentage of sales from 34.6% to 30.8%, thanks to a lower than<br />
proportional rise in purchasing costs;<br />
fixed costs (42% of total costs) will grow by an annual average of 30%, thus increasing as a<br />
proportion of sales from the current 25.2% to an expected 27.4% by YE2015.<br />
Note, however, that our analysis is rather simplistic, given that we assume all retail rents as fixed,<br />
whereas in some markets, a portion of the rents for DOS are set as a percentage of sales.<br />
MOLESKINE: costs structure (2012-15E)<br />
(€m) 2012E % <strong>2013</strong>E % 2014E % 2015E % 12/15 CAGR<br />
TOTAL COSTS 46.8 100% 56.4 100% 72.2 100% 92.1 100% 110.3<br />
VARIABLE 27.0 58% 32.2 57% 39.9 55% 48.7 53% 58.5<br />
as % of group revenues 34.6%<br />
34.1%<br />
FIXED 19.7 42% 24.2 43% 32.3 45% 43.4 47% 51.8<br />
as % of group revenues 25.2%<br />
Source: Mediobanca Securities<br />
25.6%<br />
MOLESKINE: Revenues, EBITDA & EBIT (2012-15E)<br />
(€m) 2012 <strong>2013</strong>E 2014E 2015E 12/15 CAGR<br />
REVENUES 78.1 94.5 121.8 158.0 26.5%<br />
YoY chge % 16% 21% 29% 30%<br />
GROSS PROFIT 58.4 72.0 94.7 125.2 29.0%<br />
YoY chge % 22% 23% 31% 32%<br />
Margin% 74.7% 76.2% 77.7% 79.2%<br />
EBITDA 31.4 38.0 49.6 66.0 28.1%<br />
YoY chge % 10% 21% 30% 33%<br />
Margin% 40.2% 40.3% 40.7% 41.7% 1.6%<br />
EBIT 30.4 35.5 45.6 60.5 25.7%<br />
YoY chge % 10% 17% 28% 33%<br />
Margin% 39.0% 37.6% 37.4% 38.3%<br />
Source: Mediobanca Securities, company data<br />
Earnings trend<br />
32.8%<br />
26.5%<br />
At the bottom line, we expect group net profit to grow by approximately 30% annually over the next<br />
three years, reaching €40m at YE2015. The rise in net income is likely to be driven by:<br />
30.8%<br />
27.4%<br />
THIS DOCUMENT MAY NOT BE DISTRIBUTED IN THE UNITED STATES, CANADA OR JAPAN.<br />
IPO<br />
30.8%<br />
27.3%<br />
improved EBITDA both in absolute terms and as a percentage of sales (around €35m more in<br />
2015 compared to the annual figures for FY 2012);<br />
an expected decline in net financial charges, as FCF generation reduces net debt;<br />
a tax rate assumed to be stable at 33%.<br />
<strong>04</strong> March <strong>2013</strong> ◆ 58