

moleskine-ipo-report-04-03-2013-mediobanca
moleskine-ipo-report-04-03-2013-mediobanca
moleskine-ipo-report-04-03-2013-mediobanca

Create successful ePaper yourself
Turn your PDF publications into a flip-book with our unique Google optimized e-Paper software.
Moleskine<br />
Profitability trend<br />
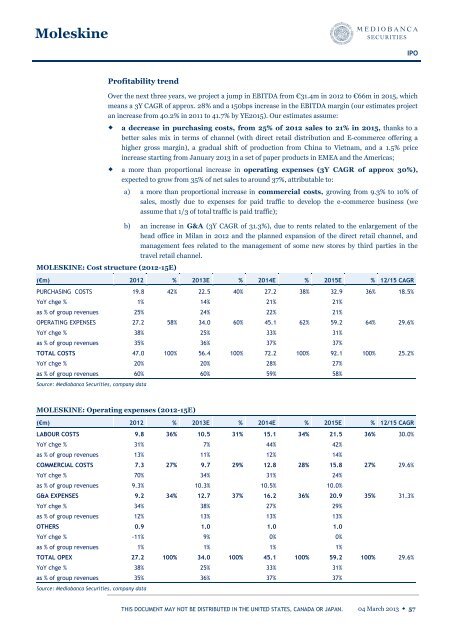
Over the next three years, we project a jump in EBITDA from €31.4m in 2012 to €66m in 2015, which<br />
means a 3Y CAGR of approx. 28% and a 150bps increase in the EBITDA margin (our estimates project<br />
an increase from 40.2% in 2011 to 41.7% by YE2015). Our estimates assume:<br />
MOLESKINE: Cost structure (2012-15E)<br />
a decrease in purchasing costs, from 25% of 2012 sales to 21% in 2015, thanks to a<br />
better sales mix in terms of channel (with direct retail distribution and E-commerce offering a<br />
higher gross margin), a gradual shift of production from China to Vietnam, and a 1.5% price<br />
increase starting from January <strong>2013</strong> in a set of paper products in EMEA and the Americas;<br />
a more than proportional increase in operating expenses (3Y CAGR of approx 30%),<br />
expected to grow from 35% of net sales to around 37%, attributable to:<br />
a) a more than proportional increase in commercial costs, growing from 9.3% to 10% of<br />
sales, mostly due to expenses for paid traffic to develop the e-commerce business (we<br />
assume that 1/3 of total traffic is paid traffic);<br />
b) an increase in G&A (3Y CAGR of 31.3%), due to rents related to the enlargement of the<br />
head office in Milan in 2012 and the planned expansion of the direct retail channel, and<br />
management fees related to the management of some new stores by third parties in the<br />
travel retail channel.<br />
(€m) 2012 % <strong>2013</strong>E % 2014E % 2015E % 12/15 CAGR<br />
PURCHASING COSTS 19.8 42% 22.5 40% 27.2 38% 32.9 36% 18.5%<br />
YoY chge % 1%<br />
as % of group revenues 25%<br />
14%<br />
24%<br />
OPERATING EXPENSES 27.2 58% 34.0 60% 45.1 62% 59.2 64% 29.6%<br />
YoY chge % 38%<br />
as % of group revenues 35%<br />
25%<br />
36%<br />
TOTAL COSTS 47.0 100% 56.4 100% 72.2 100% 92.1 100% 25.2%<br />
YoY chge % 20%<br />
as % of group revenues 60%<br />
Source: Mediobanca Securities, company data<br />
MOLESKINE: Operating expenses (2012-15E)<br />
20%<br />
60%<br />
(€m) 2012 % <strong>2013</strong>E % 2014E % 2015E % 12/15 CAGR<br />
LABOUR COSTS 9.8 36% 10.5 31% 15.1 34% 21.5 36% 30.0%<br />
YoY chge % 31%<br />
as % of group revenues 13%<br />
7%<br />
11%<br />
COMMERCIAL COSTS 7.3 27% 9.7 29% 12.8 28% 15.8 27% 29.6%<br />
YoY chge % 70%<br />
as % of group revenues 9.3%<br />
34%<br />
10.3%<br />
G&A EXPENSES 9.2 34% 12.7 37% 16.2 36% 20.9 35% 31.3%<br />
YoY chge % 34%<br />
as % of group revenues 12%<br />
OTHERS 0.9<br />
YoY chge % -11%<br />
as % of group revenues 1%<br />
38%<br />
13%<br />
1.0<br />
9%<br />
1%<br />
TOTAL OPEX 27.2 100% 34.0 100% 45.1 100% 59.2 100% 29.6%<br />
YoY chge % 38%<br />
as % of group revenues 35%<br />
Source: Mediobanca Securities, company data<br />
25%<br />
36%<br />
THIS DOCUMENT MAY NOT BE DISTRIBUTED IN THE UNITED STATES, CANADA OR JAPAN.<br />
21%<br />
22%<br />
33%<br />
37%<br />
28%<br />
59%<br />
44%<br />
12%<br />
31%<br />
10.5%<br />
27%<br />
13%<br />
1.0<br />
0%<br />
1%<br />
33%<br />
37%<br />
21%<br />
21%<br />
31%<br />
37%<br />
27%<br />
58%<br />
42%<br />
14%<br />
24%<br />
10.0%<br />
29%<br />
13%<br />
1.0<br />
0%<br />
1%<br />
31%<br />
37%<br />
IPO<br />
<strong>04</strong> March <strong>2013</strong> ◆ 57