

A Natural Areas Inventory of the - Kansas Natural Heritage Inventory ...
A Natural Areas Inventory of the - Kansas Natural Heritage Inventory ...
A Natural Areas Inventory of the - Kansas Natural Heritage Inventory ...

Create successful ePaper yourself
Turn your PDF publications into a flip-book with our unique Google optimized e-Paper software.
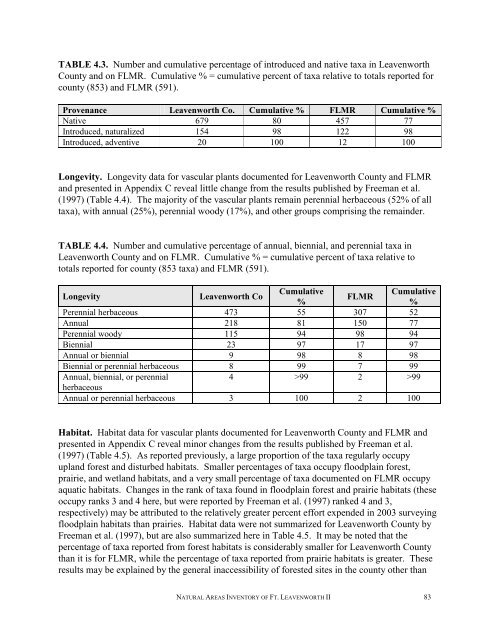
TABLE 4.3. Number and cumulative percentage <strong>of</strong> introduced and native taxa in Leavenworth<br />
County and on FLMR. Cumulative % = cumulative percent <strong>of</strong> taxa relative to totals reported for<br />
county (853) and FLMR (591).<br />
Provenance Leavenworth Co. Cumulative % FLMR Cumulative %<br />
Native 679 80 457 77<br />
Introduced, naturalized 154 98 122 98<br />
Introduced, adventive 20 100 12 100<br />
Longevity. Longevity data for vascular plants documented for Leavenworth County and FLMR<br />
and presented in Appendix C reveal little change from <strong>the</strong> results published by Freeman et al.<br />
(1997) (Table 4.4). The majority <strong>of</strong> <strong>the</strong> vascular plants remain perennial herbaceous (52% <strong>of</strong> all<br />
taxa), with annual (25%), perennial woody (17%), and o<strong>the</strong>r groups comprising <strong>the</strong> remainder.<br />
TABLE 4.4. Number and cumulative percentage <strong>of</strong> annual, biennial, and perennial taxa in<br />
Leavenworth County and on FLMR. Cumulative % = cumulative percent <strong>of</strong> taxa relative to<br />
totals reported for county (853 taxa) and FLMR (591).<br />
Longevity Leavenworth Co<br />
Cumulative<br />
%<br />
FLMR<br />
Cumulative<br />
%<br />
Perennial herbaceous 473 55 307 52<br />
Annual 218 81 150 77<br />
Perennial woody 115 94 98 94<br />
Biennial 23 97 17 97<br />
Annual or biennial 9 98 8 98<br />
Biennial or perennial herbaceous 8 99 7 99<br />
Annual, biennial, or perennial<br />
herbaceous<br />
4 >99 2 >99<br />
Annual or perennial herbaceous 3 100 2 100<br />
Habitat. Habitat data for vascular plants documented for Leavenworth County and FLMR and<br />
presented in Appendix C reveal minor changes from <strong>the</strong> results published by Freeman et al.<br />
(1997) (Table 4.5). As reported previously, a large proportion <strong>of</strong> <strong>the</strong> taxa regularly occupy<br />
upland forest and disturbed habitats. Smaller percentages <strong>of</strong> taxa occupy floodplain forest,<br />
prairie, and wetland habitats, and a very small percentage <strong>of</strong> taxa documented on FLMR occupy<br />
aquatic habitats. Changes in <strong>the</strong> rank <strong>of</strong> taxa found in floodplain forest and prairie habitats (<strong>the</strong>se<br />
occupy ranks 3 and 4 here, but were reported by Freeman et al. (1997) ranked 4 and 3,<br />
respectively) may be attributed to <strong>the</strong> relatively greater percent effort expended in 2003 surveying<br />
floodplain habitats than prairies. Habitat data were not summarized for Leavenworth County by<br />
Freeman et al. (1997), but are also summarized here in Table 4.5. It may be noted that <strong>the</strong><br />
percentage <strong>of</strong> taxa reported from forest habitats is considerably smaller for Leavenworth County<br />
than it is for FLMR, while <strong>the</strong> percentage <strong>of</strong> taxa reported from prairie habitats is greater. These<br />
results may be explained by <strong>the</strong> general inaccessibility <strong>of</strong> forested sites in <strong>the</strong> county o<strong>the</strong>r than<br />
NATURAL AREAS INVENTORY OF FT. LEAVENWORTH II 83