Observations and Modelling of Fronts and Frontogenesis
Observations and Modelling of Fronts and Frontogenesis
Observations and Modelling of Fronts and Frontogenesis

Create successful ePaper yourself
Turn your PDF publications into a flip-book with our unique Google optimized e-Paper software.
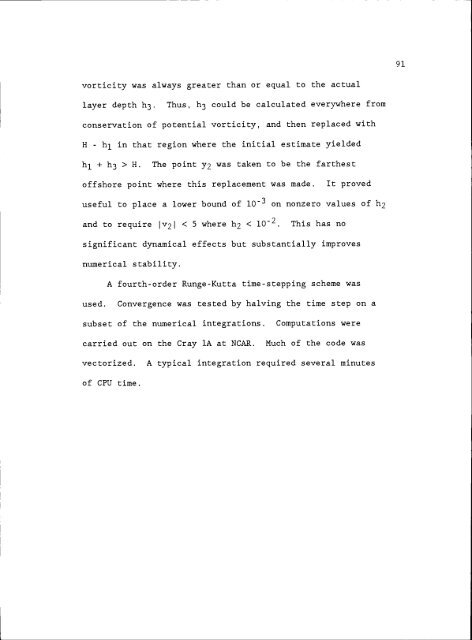
vorticity was always greater than or equal to the actual<br />
layer depth h3. Thus, h3 could be calculated everywhere from<br />
conservation <strong>of</strong> potential vorticity, <strong>and</strong> then replaced with<br />
H - h1 in that region where the initial estimate yielded<br />
h1 + h3 > H. The point y was taken to be the farthest<br />
<strong>of</strong>fshore point where this replacement was made. It proved<br />
useful to place a lower bound <strong>of</strong> lO on nonzero values <strong>of</strong> h2<br />
<strong>and</strong> to require 1v21 < 5 where h2 < io2. This has no<br />
significant dynamical effects but substantially improves<br />
numerical stability.<br />
A fourth-order Runge-Kutta time-stepping scheme was<br />
used. Convergence was tested by halving the time step on a<br />
subset <strong>of</strong> the numerical integrations. Computations were<br />
carried out on the Cray lA at NCAR. Much <strong>of</strong> the code was<br />
vectorized. A typical integration required several minutes<br />
<strong>of</strong> CPU time.<br />
91