Observations and Modelling of Fronts and Frontogenesis
Observations and Modelling of Fronts and Frontogenesis
Observations and Modelling of Fronts and Frontogenesis

Create successful ePaper yourself
Turn your PDF publications into a flip-book with our unique Google optimized e-Paper software.
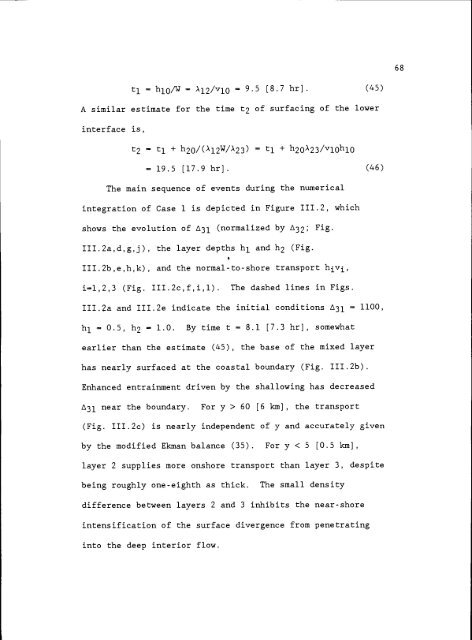
h/W = )12/v10 9.5 [8.7 hr]. (45)<br />
A similar estimate for the time t2 <strong>of</strong> surfacing <strong>of</strong> the lower<br />
interface is,<br />
t2 t1 + h20/(x12W/.X23) t1 + h20).23/v10h10<br />
- 19.5 [17.9 hr}.<br />
The main sequence <strong>of</strong> events during the numerical<br />
integration <strong>of</strong> Case 1 is depicted in Figure 111.2, which<br />
shows the evolution <strong>of</strong> 13l (normalized by 32; Fig.<br />
III.2a,d,g,j), the layer depths h1 <strong>and</strong> h2 (Fig.<br />
III.2b,e,h,k), <strong>and</strong> the normal-to-shore transport<br />
i=l,2,3 (Fig. III.2c,f,i,l). The dashed lines in Figs.<br />
(46)<br />
III.2a <strong>and</strong> III.2e indicate the initial conditions 31 1100,<br />
h1 0.5, h 1.0. By time t 8.1 [7.3 hr], somewhat<br />
earlier than the estimate (45), the base <strong>of</strong> the mixed layer<br />
has nearly surfaced at the coastal boundary (Fig. III.2b).<br />
Enhanced entrainment driven by the shallowing has decreased<br />
3l near the boundary. For y > 60 [6 km], the transport<br />
(Fig. III.2c) is nearly independent <strong>of</strong> y <strong>and</strong> accurately given<br />
by the modified Ekman balance (35). For y < 5 [0.5 km],<br />
layer 2 supplies more onshore transport than layer 3, despite<br />
being roughly one-eighth as thick. The small density<br />
difference between layers 2 <strong>and</strong> 3 inhibits the near-shore<br />
intensification <strong>of</strong> the surface divergence from penetrating<br />
into the deep interior flow.