Observations and Modelling of Fronts and Frontogenesis
Observations and Modelling of Fronts and Frontogenesis
Observations and Modelling of Fronts and Frontogenesis

Create successful ePaper yourself
Turn your PDF publications into a flip-book with our unique Google optimized e-Paper software.
V<br />
0<br />
V<br />
I...<br />
V<br />
c.4<br />
E<br />
0.<br />
0<br />
C-)<br />
0<br />
0.80<br />
0.40<br />
0.00<br />
101<br />
E 102<br />
x<br />
I,<br />
C/)<br />
a-<br />
1 ü-<br />
b)<br />
I I IIIIIIt<br />
a)<br />
I I<br />
I IjIIIII I<br />
.'iL . -<br />
\ '<br />
' \..<br />
I I II iiiI I<br />
N N N<br />
\<br />
\<br />
\ \ _\ N<br />
\\<br />
\\ \_-\<br />
\__<br />
'<br />
tt<br />
\-<br />
11111<br />
23m<br />
-s N 31 m -<br />
\___ 50 m<br />
70 m<br />
10'l 10° 101<br />
I I 111111 I 111111 II IIIII_<br />
I I I lull1 I I<br />
I I<br />
IIIIIJ<br />
IIIII<br />
102 10 10° 101<br />
k (cpkm)<br />
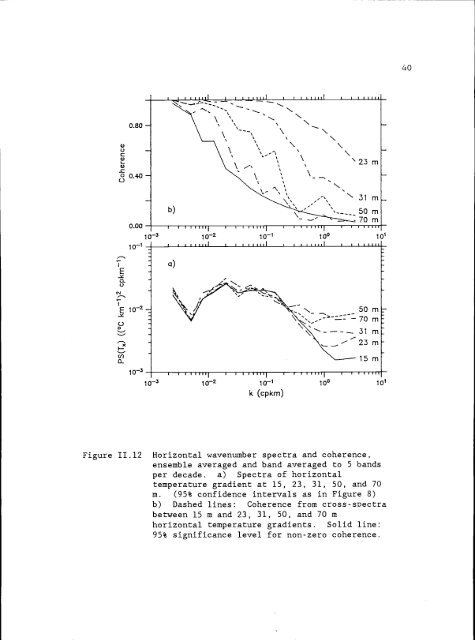
Figure 11.12 Horizontal wavenumber spectra <strong>and</strong> coherence,<br />
ensemble averaged <strong>and</strong> b<strong>and</strong> averaged to 5 b<strong>and</strong>s<br />
per decade, a) Spectra <strong>of</strong> horizontal<br />
temperature gradient at 15, 23, 31, 50, <strong>and</strong> 70<br />
m. (95% confidence intervals as in Figure 8)<br />
b) Dashed lines: Coherence from cross-spectra<br />
between 15 rn <strong>and</strong> 23, 31, 50, <strong>and</strong> 70 m<br />
horizontal temperature gradients. Solid line:<br />
95% significance level for non-zero coherence.<br />
40