Observations and Modelling of Fronts and Frontogenesis
Observations and Modelling of Fronts and Frontogenesis
Observations and Modelling of Fronts and Frontogenesis

Create successful ePaper yourself
Turn your PDF publications into a flip-book with our unique Google optimized e-Paper software.
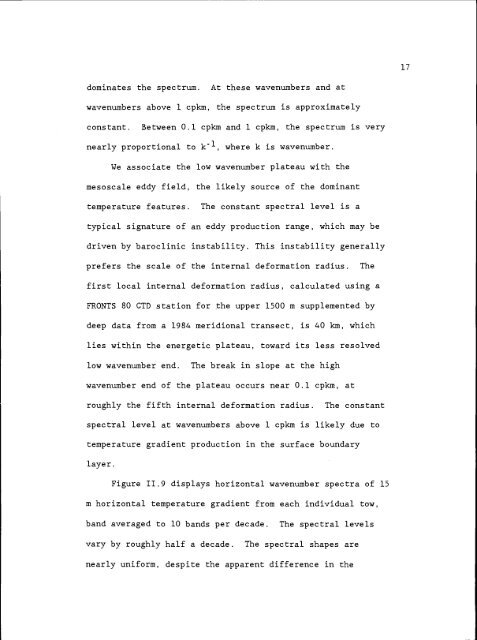
dominates the spectrum. At these wavenumbers <strong>and</strong> at<br />
wavenumbers above 1 cpkm, the spectrum is approximately<br />
constant. Between 0.1 cpkm <strong>and</strong> 1 cpkm, the spectrum is very<br />
nearly proportional to k1-, where k is wavenumber.<br />
We associate the low wavenumber plateau with the<br />
mesoscale eddy field, the likely source <strong>of</strong> the dominant<br />
temperature features. The constant spectral level is a<br />
typical signature <strong>of</strong> an eddy production range, which may be<br />
driven by baroclinic instability. This instability generally<br />
prefers the scale <strong>of</strong> the internal deformation radius. The<br />
first local internal deformation radius, calculated using a<br />
FRONTS 80 CTD station for the upper 1500 m supplemented by<br />
deep data from a 1984 meridional transect, is 40 km, which<br />
lies within the energetic plateau, toward its less resolved<br />
low wavenumber end. The break in slope at the high<br />
wavenumber end <strong>of</strong> the plateau occurs near 0.1 cpkm, at<br />
roughly the fifth internal deformation radius. The constant<br />
spectral level at wavenumbers above 1 cpkm is likely due to<br />
temperature gradient production in the surface boundary<br />
layer.<br />
Figure 11.9 displays horizontal wavenumber spectra <strong>of</strong> 15<br />
m horizontal temperature gradient from each individual tow,<br />
b<strong>and</strong> averaged to 10 b<strong>and</strong>s per decade. The spectral levels<br />
vary by roughly half a decade. The spectral shapes are<br />
nearly uniform, despite the apparent difference in the<br />
17