- Page 2 and 3:
To J.O. Irwin Mentor and friend
- Page 4 and 5:
# 1971, 1987, 1994, 2002 by Blackwe
- Page 6 and 7:
vi Contents 9.3 Factorial designs,
- Page 9 and 10:
Preface to the fourth edition In th
- Page 11 and 12:
Preface to the fourth edition xi Ho
- Page 13 and 14:
2 The scope of statistics other pat
- Page 15 and 16:
4 The scope of statistics groups is
- Page 17 and 18:
6 The scope of statistics pressure
- Page 19 and 20:
2 Describing data 2.1 Diagrams One
- Page 21 and 22:
10 Describing data 1- 4 weeks Under
- Page 23 and 24:
12 Describing data Table 2.1 Outcom
- Page 25 and 26:
14 Describing data Your height: ...
- Page 27 and 28:
16 Describing data be transferred f
- Page 29 and 30:
18 Describing data extracted from t
- Page 31 and 32:
20 Describing data many variables a
- Page 33 and 34:
22 Describing data cannot be less t
- Page 35 and 36:
24 Describing data Bufotenin (nmol/
- Page 37 and 38:
26 Describing data Frequency 20 18
- Page 39 and 40:
28 Describing data The number of as
- Page 41 and 42:
30 Describing data Frequency Measur
- Page 43 and 44:
32 Describing data may be abbreviat
- Page 45 and 46:
34 Describing data variables follow
- Page 47 and 48:
36 Describing data 107 01. The geom
- Page 49 and 50:
38 Describing data If the number of
- Page 51 and 52:
40 Describing data Therefore the me
- Page 53 and 54:
42 Describing data xi x will then n
- Page 55 and 56:
44 Describing data taking the antil
- Page 57 and 58:
46 Describing data against their ef
- Page 59 and 60:
48 Probability example, is sometime
- Page 61 and 62:
50 Probability It will appear in du
- Page 63 and 64:
52 Probability In general, pairs of
- Page 65 and 66:
54 Probability the five types be cl
- Page 67 and 68:
56 Probability converted to a ratio
- Page 69 and 70:
58 Probability Correct Equivocal In
- Page 71 and 72:
60 Probability Probability 1 . 0 0
- Page 73 and 74:
62 Probability Probability density
- Page 75 and 76:
64 Probability As a second example,
- Page 77 and 78:
66 Probability coefficient. In the
- Page 79 and 80:
68 Probability n r pr …1 p† n r
- Page 81 and 82:
70 Probability π = 0 Probability .
- Page 83 and 84:
72 Probability 0 } — T n Fig. 3.8
- Page 85 and 86:
74 Probability Probability 0 . 4 0
- Page 87 and 88:
76 Probability Table 3.4 Binomial a
- Page 89 and 90:
78 Probability where exp(z) is a co
- Page 91 and 92:
80 Probability approaches the shape
- Page 93 and 94:
82 Probability Probabililty density
- Page 95 and 96:
84 Analysing means and proportions
- Page 97 and 98:
86 Analysing means and proportions
- Page 99 and 100:
88 Analysing means and proportions
- Page 101 and 102:
90 Analysing means and proportions
- Page 103 and 104:
92 Analysing means and proportions
- Page 105 and 106:
94 Analysing means and proportions
- Page 107 and 108:
96 Analysing means and proportions
- Page 109 and 110:
98 Analysing means and proportions
- Page 111 and 112:
100 Analysing means and proportions
- Page 113 and 114:
102 Analysing means and proportions
- Page 115 and 116:
104 Analysing means and proportions
- Page 117 and 118:
106 Analysing means and proportions
- Page 119 and 120:
108 Analysing means and proportions
- Page 121 and 122:
110 Analysing means and proportions
- Page 123 and 124:
112 Analysing means and proportions
- Page 125 and 126:
114 Analysing means and proportions
- Page 127 and 128:
116 Analysing means and proportions
- Page 129 and 130:
118 Analysing means and proportions
- Page 131 and 132:
120 Analysing means and proportions
- Page 133 and 134:
122 Analysing means and proportions
- Page 135 and 136:
124 Analysing means and proportions
- Page 137 and 138:
126 Analysing means and proportions
- Page 139 and 140:
128 Analysing means and proportions
- Page 141 and 142:
130 Analysing means and proportions
- Page 143 and 144:
132 Analysing means and proportions
- Page 145 and 146:
134 Analysing means and proportions
- Page 147 and 148:
136 Analysing means and proportions
- Page 149 and 150:
138 Analysing means and proportions
- Page 151 and 152:
140 Analysing means and proportions
- Page 153 and 154:
142 Analysing means and proportions
- Page 155 and 156:
144 Analysing means and proportions
- Page 157 and 158:
146 Analysing means and proportions
- Page 159 and 160:
148 Analysing variances Probability
- Page 161 and 162:
150 Analysing variances headings 0
- Page 163 and 164:
152 Analysing variances Method AB N
- Page 165 and 166:
154 Analysing variances Example 5.2
- Page 167 and 168:
156 Analysing variances Comparison
- Page 169 and 170:
158 Analysing variances With contin
- Page 171 and 172:
160 Analysing variances Let y ˆ x1
- Page 173 and 174:
162 Analysing variances p … log x
- Page 175 and 176:
164 Analysing variances as expected
- Page 177 and 178:
166 Bayesian methods This argument
- Page 179 and 180:
168 Bayesian methods nothing of the
- Page 181 and 182:
170 Bayesian methods in this way. F
- Page 183 and 184:
172 Bayesian methods In some situat
- Page 185 and 186:
174 Bayesian methods difference bet
- Page 187 and 188:
176 Bayesian methods the distributi
- Page 189 and 190:
178 Bayesian methods In the unpaire
- Page 191 and 192:
180 Bayesian methods The examples d
- Page 193 and 194:
182 Bayesian methods difference bet
- Page 195 and 196:
184 Bayesian methods variation may
- Page 197 and 198:
186 Bayesian methods The resulting
- Page 199 and 200:
188 Regression and correlation Infa
- Page 201 and 202:
190 Regression and correlation y x
- Page 203 and 204:
192 Regression and correlation on s
- Page 205 and 206:
194 Regression and correlation y ,
- Page 207 and 208:
196 Regression and correlation y (a
- Page 209 and 210:
198 Regression and correlation incr
- Page 211 and 212:
200 Regression and correlation From
- Page 213 and 214:
202 Regression and correlation y ,
- Page 215 and 216:
204 Regression and correlation Valu
- Page 217 and 218:
206 Regression and correlation disc
- Page 219 and 220:
8 Comparison of several groups 8.1
- Page 221 and 222:
210 Comparison of several groups P
- Page 223 and 224:
212 Comparison of several groups s
- Page 225 and 226:
214 Comparison of several groups to
- Page 227 and 228:
216 Comparison of several groups sh
- Page 229 and 230:
218 Comparison of several groups s
- Page 231 and 232:
220 Comparison of several groups su
- Page 233 and 234:
222 Comparison of several groups No
- Page 235 and 236:
224 Comparison of several groups yc
- Page 237 and 238:
226 Comparison of several groups Q
- Page 239 and 240:
228 Comparison of several groups te
- Page 241 and 242:
230 Comparison of several groups Ta
- Page 243 and 244:
232 Comparison of several groups Ta
- Page 245 and 246:
234 Comparison of several groups th
- Page 247 and 248:
9 Experimental design 9.1 General r
- Page 249 and 250:
238 Experimental design the estimat
- Page 251 and 252:
240 Experimental design Table 9.1 N
- Page 253 and 254:
242 Experimental design Similarly,
- Page 255 and 256:
244 Experimental design The sum of
- Page 257 and 258:
246 Experimental design If, in a tw
- Page 259 and 260:
248 Experimental design Table 9.5 S
- Page 261 and 262:
250 Experimental design interaction
- Page 263 and 264:
252 Experimental design difference
- Page 265 and 266:
254 Experimental design Table 9.7 C
- Page 267 and 268:
256 Experimental design interaction
- Page 269 and 270:
258 Experimental design litters and
- Page 271 and 272:
260 Experimental design randomizati
- Page 273 and 274:
262 Experimental design rows, colum
- Page 275 and 276:
264 Experimental design type of des
- Page 277 and 278:
266 Experimental design Main unit S
- Page 279 and 280:
268 Experimental design categories
- Page 281 and 282:
270 Experimental design Example 9.6
- Page 283 and 284:
10 Analysing non-normal data 10.1 D
- Page 285 and 286: 274 Analysing non-normal data The s
- Page 287 and 288: 276 Analysing non-normal data Estim
- Page 289 and 290: 278 Analysing non-normal data betwe
- Page 291 and 292: Table 10.1 Some properties of three
- Page 293 and 294: 282 Analysing non-normal data This
- Page 295 and 296: 284 Analysing non-normal data High
- Page 297 and 298: 286 Analysing non-normal data which
- Page 299 and 300: 288 Analysing non-normal data Table
- Page 301 and 302: 290 Analysing non-normal data 1 It
- Page 303 and 304: 292 Analysing non-normal data It is
- Page 305 and 306: 294 Analysing non-normal data proba
- Page 307 and 308: 296 Analysing non-normal data Fract
- Page 309 and 310: 298 Analysing non-normal data h=…
- Page 311 and 312: 300 Analysing non-normal data This
- Page 313 and 314: 302 Analysing non-normal data Boots
- Page 315 and 316: 304 Analysing non-normal data more
- Page 317 and 318: 306 Analysing non-normal data Sampl
- Page 319 and 320: 308 Analysing non-normal data 3 squ
- Page 321 and 322: 310 Analysing non-normal data mG ˆ
- Page 323 and 324: 11 Modelling continuous data 11.1 A
- Page 325 and 326: 314 Modelling continuous data Examp
- Page 327 and 328: 316 Modelling continuous data n k i
- Page 329 and 330: 318 Modelling continuous data consi
- Page 331 and 332: 320 Modelling continuous data basis
- Page 333 and 334: 322 Modelling continuous data 11.4
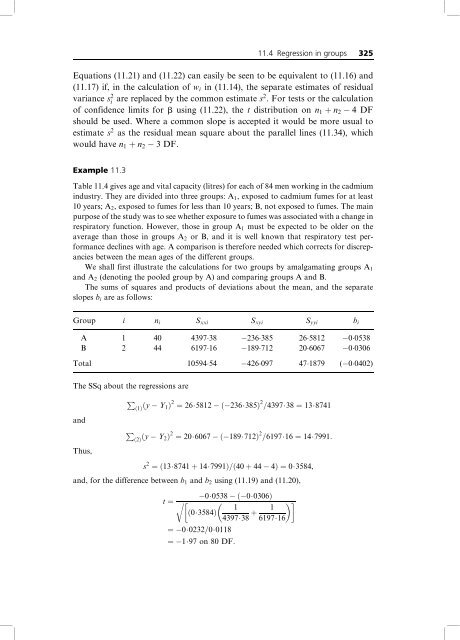
- Page 335: 324 Modelling continuous data var
- Page 339 and 340: 328 Modelling continuous data Again
- Page 341 and 342: 330 Modelling continuous data SSq D
- Page 343 and 344: 332 Modelling continuous data Two g
- Page 345 and 346: 334 Modelling continuous data which
- Page 347 and 348: 336 Modelling continuous data the i
- Page 349 and 350: 338 Modelling continuous data predi
- Page 351 and 352: 340 Modelling continuous data equat
- Page 353 and 354: 342 Modelling continuous data Table
- Page 355 and 356: 344 Modelling continuous data Somet
- Page 357 and 358: 346 Modelling continuous data multi
- Page 359 and 360: 348 Modelling continuous data (i) D
- Page 361 and 362: 350 Modelling continuous data The r
- Page 363 and 364: 352 Modelling continuous data In th
- Page 365 and 366: 354 Modelling continuous data The c
- Page 367 and 368: 356 Modelling continuous data If th
- Page 369 and 370: 358 Modelling continuous data at th
- Page 371 and 372: 360 Modelling continuous data about
- Page 373 and 374: 362 Modelling continuous data y −
- Page 375 and 376: 364 Modelling continuous data y −
- Page 377 and 378: 366 Modelling continuous data outli
- Page 379 and 380: 368 Modelling continuous data Table
- Page 381 and 382: 370 Modelling continuous data Patie
- Page 383 and 384: 372 Modelling continuous data Norma
- Page 385 and 386: 374 Modelling continuous data Cumul
- Page 387 and 388:
376 Modelling continuous data Table
- Page 389 and 390:
12 Further regression models for a
- Page 391 and 392:
380 Further regression models Table
- Page 393 and 394:
382 Further regression models repre
- Page 395 and 396:
384 Further regression models where
- Page 397 and 398:
386 Further regression models Popul
- Page 399 and 400:
388 Further regression models and S
- Page 401 and 402:
390 Further regression models s(x)
- Page 403 and 404:
392 Further regression models SS ˆ
- Page 405 and 406:
394 Further regression models A…a
- Page 407 and 408:
396 Further regression models and t
- Page 409 and 410:
398 Further regression models that
- Page 411 and 412:
400 Further regression models Regre
- Page 413 and 414:
402 Further regression models M…T
- Page 415 and 416:
404 Further regression models a0
- Page 417 and 418:
406 Further regression models Maxim
- Page 419 and 420:
408 Further regression models using
- Page 421 and 422:
410 Further regression models suppo
- Page 423 and 424:
412 Further regression models Dose
- Page 425 and 426:
414 Further regression models Condu
- Page 427 and 428:
416 Further regression models the p
- Page 429 and 430:
418 Further regression models To be
- Page 431 and 432:
420 Further regression models 9.5.
- Page 433 and 434:
422 Further regression models in Ex
- Page 435 and 436:
424 Further regression models param
- Page 437 and 438:
426 Further regression models namel
- Page 439 and 440:
428 Further regression models All t
- Page 441 and 442:
430 Further regression models A not
- Page 443 and 444:
432 Further regression models Appro
- Page 445 and 446:
434 Further regression models form
- Page 447 and 448:
436 Further regression models times
- Page 449 and 450:
438 Further regression models block
- Page 451 and 452:
440 Further regression models This
- Page 453 and 454:
442 Further regression models Here
- Page 455 and 456:
444 Further regression models follo
- Page 457 and 458:
446 Further regression models missi
- Page 459 and 460:
448 Further regression models probl
- Page 461 and 462:
450 Further regression models perio
- Page 463 and 464:
452 Further regression models betwe
- Page 465 and 466:
454 Further regression models Spell
- Page 467 and 468:
456 Multivariate methods 13.2 Princ
- Page 469 and 470:
458 Multivariate methods High loadi
- Page 471 and 472:
Table 13.1 Correlation matrix of 20
- Page 473 and 474:
462 Multivariate methods eigenvalue
- Page 475 and 476:
464 Multivariate methods The place
- Page 477 and 478:
466 Multivariate methods allocation
- Page 479 and 480:
468 Multivariate methods would pred
- Page 481 and 482:
470 Multivariate methods and We fol
- Page 483 and 484:
472 Multivariate methods In the dis
- Page 485 and 486:
474 Multivariate methods Paired dat
- Page 487 and 488:
476 Multivariate methods Mean SE (m
- Page 489 and 490:
478 Multivariate methods x (3) x (5
- Page 491 and 492:
480 Multivariate methods Allocation
- Page 493 and 494:
482 Multivariate methods diagram in
- Page 495 and 496:
484 Multivariate methods explanator
- Page 497 and 498:
486 Modelling categorical data In t
- Page 499 and 500:
488 Modelling categorical data calc
- Page 501 and 502:
490 Modelling categorical data as t
- Page 503 and 504:
492 Modelling categorical data DF.
- Page 505 and 506:
494 Modelling categorical data in a
- Page 507 and 508:
496 Modelling categorical data if p
- Page 509 and 510:
498 Modelling categorical data When
- Page 511 and 512:
500 Modelling categorical data Tabl
- Page 513 and 514:
502 Modelling categorical data The
- Page 515 and 516:
504 Empirical methods for categoric
- Page 517 and 518:
506 Empirical methods for categoric
- Page 519 and 520:
508 Empirical methods for categoric
- Page 521 and 522:
510 Empirical methods for categoric
- Page 523 and 524:
512 Empirical methods for categoric
- Page 525 and 526:
514 Empirical methods for categoric
- Page 527 and 528:
516 Empirical methods for categoric
- Page 529 and 530:
518 Empirical methods for categoric
- Page 531 and 532:
520 Empirical methods for categoric
- Page 533 and 534:
522 Empirical methods for categoric
- Page 535 and 536:
524 Empirical methods for categoric
- Page 537 and 538:
526 Empirical methods for categoric
- Page 539 and 540:
16 Further Bayesian methods 16.1 Ba
- Page 541 and 542:
530 Further Bayesian methods Analyt
- Page 543 and 544:
532 Further Bayesian methods compli
- Page 545 and 546:
534 Further Bayesian methods One ap
- Page 547 and 548:
536 Further Bayesian methods result
- Page 549 and 550:
538 Further Bayesian methods (i) th
- Page 551 and 552:
540 Further Bayesian methods From (
- Page 553 and 554:
542 Further Bayesian methods A stra
- Page 555 and 556:
544 Further Bayesian methods the st
- Page 557 and 558:
546 Further Bayesian methods but ma
- Page 559 and 560:
548 Further Bayesian methods σ 30
- Page 561 and 562:
550 Further Bayesian methods practi
- Page 563 and 564:
552 Further Bayesian methods which
- Page 565 and 566:
554 Further Bayesian methods Densit
- Page 567 and 568:
556 Further Bayesian methods recurr
- Page 569 and 570:
558 Further Bayesian methods a ˆ m
- Page 571 and 572:
560 Further Bayesian methods values
- Page 573 and 574:
562 Further Bayesian methods distri
- Page 575 and 576:
564 Further Bayesian methods the se
- Page 577 and 578:
566 Further Bayesian methods probab
- Page 579 and 580:
17 Survival analysis 17.1 Introduct
- Page 581 and 582:
570 Survival analysis Table 17.1 Cu
- Page 583 and 584:
572 Survival analysis Table 17.2 Li
- Page 585 and 586:
574 Survival analysis otherwise the
- Page 587 and 588:
576 Survival analysis qtj ˆ dj=n 0
- Page 589 and 590:
578 Survival analysis quantities in
- Page 591 and 592:
580 Survival analysis Survival % 10
- Page 593 and 594:
582 Survival analysis logrank test
- Page 595 and 596:
584 Survival analysis the mean surv
- Page 597 and 598:
586 Survival analysis the death rat
- Page 599 and 600:
588 Survival analysis McGilchrist a
- Page 601 and 602:
590 Survival analysis The martingal
- Page 603 and 604:
592 Clinical trials trials. In drug
- Page 605 and 606:
594 Clinical trials first type of e
- Page 607 and 608:
596 Clinical trials . Proposed numb
- Page 609 and 610:
598 Clinical trials If the response
- Page 611 and 612:
600 Clinical trials methods of Baye
- Page 613 and 614:
602 Clinical trials represented by
- Page 615 and 616:
604 Clinical trials physicians find
- Page 617 and 618:
606 Clinical trials very minor proc
- Page 619 and 620:
608 Clinical trials each patient's
- Page 621 and 622:
610 Clinical trials Table 18.1 Resu
- Page 623 and 624:
612 Clinical trials solution is ava
- Page 625 and 626:
614 Clinical trials Administrative
- Page 627 and 628:
616 Clinical trials non-sequential
- Page 629 and 630:
618 Clinical trials Table 18.3 Maxi
- Page 631 and 632:
620 Clinical trials Standardized de
- Page 633 and 634:
622 Clinical trials A somewhat diff
- Page 635 and 636:
624 Clinical trials A trial showing
- Page 637 and 638:
626 Clinical trials Publication bia
- Page 639 and 640:
628 Clinical trials on different oc
- Page 641 and 642:
630 Clinical trials Table 18.5 Numb
- Page 643 and 644:
632 Clinical trials Treatment perio
- Page 645 and 646:
634 Clinical trials in cases where
- Page 647 and 648:
636 Clinical trials independent, an
- Page 649 and 650:
638 Clinical trials Sample size The
- Page 651 and 652:
640 Clinical trials and the restric
- Page 653 and 654:
642 Clinical trials original data.
- Page 655 and 656:
644 Clinical trials if the odds rat
- Page 657 and 658:
646 Clinical trials 3 2 1 0 -1 -2 -
- Page 659 and 660:
19 Statistical methods in epidemiol
- Page 661 and 662:
650 Statistical methods in epidemio
- Page 663 and 664:
652 Statistical methods in epidemio
- Page 665 and 666:
654 Statistical methods in epidemio
- Page 667 and 668:
656 Statistical methods in epidemio
- Page 669 and 670:
658 Statistical methods in epidemio
- Page 671 and 672:
660 Statistical methods in epidemio
- Page 673 and 674:
662 Statistical methods in epidemio
- Page 675 and 676:
Table 19.1 Death rate for two popul
- Page 677 and 678:
666 Statistical methods in epidemio
- Page 679 and 680:
668 Statistical methods in epidemio
- Page 681 and 682:
670 Statistical methods in epidemio
- Page 683 and 684:
672 Statistical methods in epidemio
- Page 685 and 686:
674 Statistical methods in epidemio
- Page 687 and 688:
676 Statistical methods in epidemio
- Page 689 and 690:
678 Statistical methods in epidemio
- Page 691 and 692:
680 Statistical methods in epidemio
- Page 693 and 694:
682 Statistical methods in epidemio
- Page 695 and 696:
684 Statistical methods in epidemio
- Page 697 and 698:
686 Statistical methods in epidemio
- Page 699 and 700:
688 Statistical methods in epidemio
- Page 701 and 702:
690 Statistical methods in epidemio
- Page 703 and 704:
692 Statistical methods in epidemio
- Page 705 and 706:
694 Statistical methods in epidemio
- Page 707 and 708:
696 Statistical methods in epidemio
- Page 709 and 710:
698 Statistical methods in epidemio
- Page 711 and 712:
700 Statistical methods in epidemio
- Page 713 and 714:
702 Statistical methods in epidemio
- Page 715 and 716:
704 Statistical methods in epidemio
- Page 717 and 718:
706 Statistical methods in epidemio
- Page 719 and 720:
708 Statistical methods in epidemio
- Page 721 and 722:
710 Statistical methods in epidemio
- Page 723 and 724:
712 Statistical methods in epidemio
- Page 725 and 726:
714 Statistical methods in epidemio
- Page 727 and 728:
716 Statistical methods in epidemio
- Page 729 and 730:
718 Laboratory assays such cases, t
- Page 731 and 732:
720 Laboratory assays and YT ˆ yT
- Page 733 and 734:
722 Laboratory assays significant a
- Page 735 and 736:
724 Laboratory assays The general p
- Page 737 and 738:
726 Laboratory assays This relation
- Page 739 and 740:
728 Laboratory assays Proportion po
- Page 741 and 742:
730 Laboratory assays P contribute
- Page 743 and 744:
732 Laboratory assays transformatio
- Page 745 and 746:
734 Laboratory assays Table 20.1 Es
- Page 747 and 748:
736 Laboratory assays P m iˆ1 ri l
- Page 749 and 750:
738 Laboratory assays synthesize hi
- Page 751 and 752:
740 Laboratory assays estimate of a
- Page 754 and 755:
Appendix tables 743
- Page 756 and 757:
2 0 0 02275 0 02222 0 02169 0 02118
- Page 758 and 759:
16 6 91 93 1 11 91 153 4 19 3 7 23
- Page 760 and 761:
16 0 128 0 258 0 392 0 535 0 690 0
- Page 762 and 763:
5 0 05 6 61 5 79 5 41 5 19 5 05 4 9
- Page 764 and 765:
3 0 0 05 4 17 3 32 2 92 2 69 2 53 2
- Page 766 and 767:
14 0.05 3 03 3 70 4 11 4 41 4 64 4
- Page 768 and 769:
Table A7 Percentage points for the
- Page 770 and 771:
Table A9 Sample size for detecting
- Page 772 and 773:
Bailey N.T.J. (1975) The Mathematic
- Page 774 and 775:
Buyse M.E., Staquet M.J. and Sylves
- Page 776 and 777:
eceptor interactions. J. Ster. Bioc
- Page 778 and 779:
Etzioni R.D. and Weiss N.S. (1998)
- Page 780 and 781:
Goetghebeur E. and Lapp K. (1997) T
- Page 782 and 783:
sample data in randomized block and
- Page 784 and 785:
Lehmann E.L. (1975) Nonparametrics:
- Page 786 and 787:
Mehta C.R. (1994) The exact analysi
- Page 788 and 789:
Peto R., Pike M., Day N. et al. (19
- Page 790 and 791:
Scott J.E.S., Hunter E.W., Lee R.E.
- Page 792 and 793:
Thompson S.G. and Barber J.A. (2000
- Page 794 and 795:
Zhang H., Crowley J., Sox H.C. and
- Page 796 and 797:
786 Author Index Brooks, S.P. 549,
- Page 798 and 799:
788 Author Index Gart, J.J. 127, 67
- Page 800 and 801:
790 Author Index Laurence, D.R. 519
- Page 802 and 803:
792 Author Index RamoÂn, J.M. 536
- Page 804 and 805:
794 Author Index Westley-Wise, V.J.
- Page 806 and 807:
796 Subject Index Assays (cont.) ra
- Page 808 and 809:
798 Subject Index Chronic obstructi
- Page 810 and 811:
800 Subject Index Continuous variab
- Page 812 and 813:
802 Subject Index Dot diagram 23, 2
- Page 814 and 815:
804 Subject Index Growth curves 409
- Page 816 and 817:
806 Subject Index McNemar's test 12
- Page 818 and 819:
808 Subject Index Normal (cont.) st
- Page 820 and 821:
810 Subject Index Proportions Bayes
- Page 822 and 823:
812 Subject Index Roughness penalty
- Page 824 and 825:
814 Subject Index Standard (cont.)
- Page 826:
816 Subject Index Tumour (cont.) in