Annual Report 2010 - Verein der Kohlenimporteure eV
Annual Report 2010 - Verein der Kohlenimporteure eV
Annual Report 2010 - Verein der Kohlenimporteure eV

You also want an ePaper? Increase the reach of your titles
YUMPU automatically turns print PDFs into web optimized ePapers that Google loves.
Photovoltaics made enormous progress, growing by<br />
about 80% from 24 PJ to 45 PJ or 1.46 Mtce. The share<br />
of all renewable energies in primary energy consumption<br />
increased from 8.9% to 9.4%. The 1,320 PJ or 45 Mtce<br />
from renewables were utilised as shown below:<br />
<br />
generation of electricity;<br />
<br />
heating market; and<br />
<br />
production of fuel.<br />
Energy Productivity Continues to Improve –<br />
But Below Average<br />
Energy productivity – measured in euros per gigajoule<br />
– improved temperature adjusted by 1.6% in <strong>2010</strong>. The<br />
best way to evaluate the structural development is to<br />
use values adjusted for temperature and stock changes:<br />
Energy Productivity<br />
2009 <strong>2010</strong><br />
Difference<br />
in %<br />
Gross Domestic Product (€ bn)<br />
Primary Energy Consumption<br />
in Petajoules<br />
(Adjusted for temperature and<br />
2,169 2,248 3.6<br />
stock changes) 13,610 13,853 1.8<br />
Energy Productivity (in €/GJ) 159 162 - 1.6<br />
HT-D3 Source: AGEB, provisional data<br />
This growth in energy productivity almost reached the<br />
long-term average of 1.8% (1990-<strong>2010</strong>).<br />
Electricity Generation Increases Significantly<br />
by 5.2%<br />
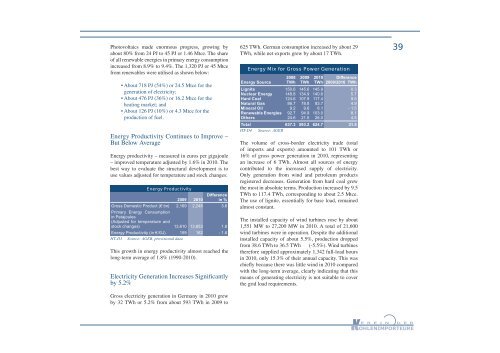
Gross electricity generation in Germany in <strong>2010</strong> grew<br />
by 32 TWh or 5.2% from about 593 TWh in 2009 to<br />
625 TWh. German consumption increased by about 29<br />
<br />
Energy Mix for Gross Power Generation<br />
Energy Source<br />
Lignite<br />
Nuclear Energy<br />
Hard Coal<br />
Natural Gas<br />
Mineral Oil<br />
Renewable Energies<br />
Others<br />
2008<br />
TWh<br />
150.6<br />
148.8<br />
124.6<br />
86.7<br />
9.2<br />
92.7<br />
24.6<br />
2009<br />
TWh<br />
145.6<br />
134.9<br />
107.9<br />
78.8<br />
9.6<br />
94.9<br />
21.5<br />
<strong>2010</strong><br />
TWh<br />
145.9<br />
140.6<br />
117.4<br />
83.7<br />
8.1<br />
103.0<br />
26.0<br />
Difference<br />
2009/<strong>2010</strong> TWh<br />
0.3<br />
5.7<br />
9.5<br />
4.9<br />
- 1.5<br />
8.1<br />
4.5<br />
Total 637.3 593.2 624.7 31.5<br />
HT-D4 Source: AGEB<br />
The volume of cross-bor<strong>der</strong> electricity trade (total<br />
of imports and exports) amounted to 101 TWh or<br />
16% of gross power generation in <strong>2010</strong>, representing<br />
an increase of 6 TWh. Almost all sources of energy<br />
contributed to the increased supply of electricity.<br />
Only generation from wind and petroleum products<br />
registered decreases. Generation from hard coal grew<br />
the most in absolute terms. Production increased by 9.5<br />
<br />
The use of lignite, essentially for base load, remained<br />
almost constant.<br />
The installed capacity of wind turbines rose by about<br />
<br />
wind turbines were in operation. Despite the additional<br />
installed capacity of about 5.5%, production dropped<br />
from 38.6 TWh to 36.5 TWh (-5.5%). Wind turbines<br />
therefore supplied approximately 1,342 full-load hours<br />
in <strong>2010</strong>, only 15.3% of their annual capacity. This was<br />
chiefly because there was little wind in <strong>2010</strong> compared<br />
with the long-term average, clearly indicating that this<br />
means of generating electricity is not suitable to cover<br />
the grid load requirements.<br />
39