Annual Report 2010 - Verein der Kohlenimporteure eV
Annual Report 2010 - Verein der Kohlenimporteure eV
Annual Report 2010 - Verein der Kohlenimporteure eV

You also want an ePaper? Increase the reach of your titles
YUMPU automatically turns print PDFs into web optimized ePapers that Google loves.
66<br />
Australia holds a share of about 33% of the international<br />
hard coal market: 64% of the world market for coking<br />
coal and 19% for steam coal. Australia has the largest<br />
potential for a sustainable expansion of steam and coking<br />
coal exports in the long-term. By 2030, expansion of<br />
exports to 400-500 million tonnes is conceivable.<br />
Infrastructure<br />
Australia’s infrastructure was again at full capacity in<br />
<strong>2010</strong> and an Achilles heel for exporters. However, the<br />
first steps in a new round of port expansions were seen.<br />
<br />
<br />
at the port of Newcastle investment was made in 30<br />
million tonnes of additional annual shipping capacity<br />
for steam coal. <strong>Annual</strong> export quantities could be<br />
increased by a further 18 million tonnes. After these<br />
expansion measures at the ports, the focus is shifting<br />
to the bottlenecks caused by rail transport. Progress<br />
can already be observed. The Australian government<br />
has put forward a national construction programme<br />
according to which NSW will make investments of<br />
AUS$12 billion available to develop rail capacity in<br />
the Hunter Valley, as well as AUS$1 billion to improve<br />
existing capacity in or<strong>der</strong> to reduce queues to the port<br />
of Newcastle. Queues continue to dog other Australian<br />
ports. The entire infrastructure of Queensland was<br />
badly affected towards the end of <strong>2010</strong> and beginning<br />
of 2011 because of heavy rainfall and cyclones. These<br />
damaged rail tracks and port infrastructure. Exports<br />
were eventually hit in 2011, although production<br />
was affected immediately. Estimates are based on the<br />
assumption of a decrease in production from 20 million<br />
tonnes up to 100 million tonnes in 2011.<br />
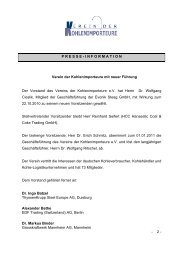
Exports of the Coal Loading Ports<br />
Coal Loading Por<br />
Abbot Point<br />
Dalrymple Bay<br />
Hay Point<br />
Gladstone<br />
Brisbane<br />
Total Queensland<br />
Newcastle<br />
Port Kembla<br />
Total New South Wales<br />
2008<br />
Mt<br />
13.7<br />
48.0<br />
36.0<br />
56.0<br />
5.3<br />
159.0<br />
91.5<br />
11.7<br />
103.2<br />
2009<br />
Mt<br />
15.3<br />
54.2<br />
35.0<br />
58.0<br />
6.3<br />
168.8<br />
92.8<br />
15.0<br />
107.8<br />
<strong>2010</strong><br />
Mt<br />
17.4<br />
62.7<br />
36.4<br />
61.7<br />
7.6<br />
185.8<br />
95.1<br />
13.3<br />
108.4<br />
Total 262.2 276.6 294.2<br />
LB-T2<br />
The transhipment figures for coal loading ports do<br />
not match precisely with export figures. There may be<br />
customs-related reasons for this.<br />
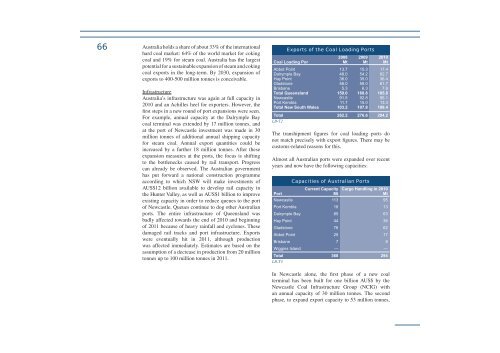
Almost all Australian ports were expanded over recent<br />
years and now have the following capacities:<br />
Capacities of Australian Ports<br />
Current Capacity Cargo Handling in <strong>2010</strong><br />
Port<br />
Mt<br />
Mt<br />
Newcastle 113 95<br />
Port Kembla 18 13<br />
Dalrymple Bay 85 63<br />
Hay Point 44 36<br />
Gladstone 76 62<br />
Abbot Point 25 17<br />
Brisbane 7 8<br />
Wiggins Island --- ---<br />
Total<br />
LB-T3<br />
368 294<br />
In Newcastle alone, the first phase of a new coal<br />
terminal has been built for one billion AUS$ by the<br />
Newcastle Coal Infrastructure Group (NCIG) with<br />
an annual capacity of 30 million tonnes. The second<br />
phase, to expand export capacity to 53 million tonnes,