Annual Report 2010 - Verein der Kohlenimporteure eV
Annual Report 2010 - Verein der Kohlenimporteure eV
Annual Report 2010 - Verein der Kohlenimporteure eV

You also want an ePaper? Increase the reach of your titles
YUMPU automatically turns print PDFs into web optimized ePapers that Google loves.
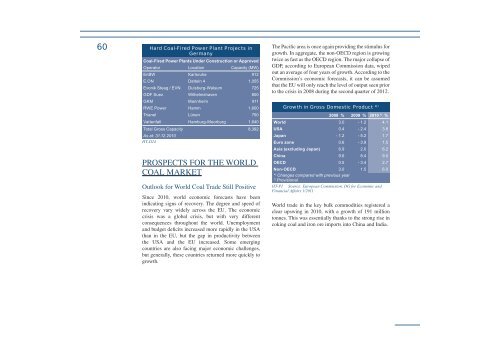
60 Hard Coal-Fired Power Plant Projects in<br />
Germany<br />
Coal-Fired Power Plants Un<strong>der</strong> Construction or Approved<br />
Operator Location Capacity (MW)<br />
EnBW Karlsruhe 912<br />
E.ON Datteln 4 1,055<br />
Evonik Steag / EVN Duisburg-Walsum 725<br />
GDF Suez Wilhelmshaven 800<br />
GKM Mannheim 911<br />
RWE Power Hamm 1,600<br />
Trianel Lünen 750<br />
Vattenfall Hamburg-Moorburg 1,640<br />
Total Gross Capacity<br />
<br />
HT-D24<br />
8,392<br />
<br />
COAL MARKET<br />
Outlook for World Coal Trade Still Positive<br />
Since <strong>2010</strong>, world economic forecasts have been<br />
indicating signs of recovery. The degree and speed of<br />
recovery vary widely across the EU. The economic<br />
crisis was a global crisis, but with very different<br />
consequences throughout the world. Unemployment<br />
and budget deficits increased more rapidly in the USA<br />
than in the EU, but the gap in productivity between<br />
the USA and the EU increased. Some emerging<br />
countries are also facing major economic challenges,<br />
but generally, these countries returned more quickly to<br />
growth.<br />
The Pacific area is once again providing the stimulus for<br />
growth. In aggregate, the non-OECD region is growing<br />
twice as fast as the OECD region. The major collapse of<br />
GDP, according to European Commission data, wiped<br />
out an average of four years of growth. According to the<br />
Commission’s economic forecasts, it can be assumed<br />
that the EU will only reach the level of output seen prior<br />
to the crisis in 2008 during the second quarter of 2012.<br />
Growth in Gross Domestic Product * )<br />
2008 % 2009 % <strong>2010</strong> 1) %<br />
World 3.0 - 1.2 4.1<br />
USA 0.4 - 2.4 3.8<br />
Japan - 1.2 - 5.2 1.7<br />
Euro zone 0.6 - 3.9 1.5<br />
Asia (excluding Japan) 6.9 2.0 6.2<br />
China 9.6 8.4 9.0<br />
OECD 0.5 - 3.4 2.7<br />
Non-OECD 3.0 1.5 6.0<br />
* ) <br />
1) <br />
HT-P1 Source: European Commission, DG for Economic and<br />
Financial Affairs 1/2011<br />
World trade in the key bulk commodities registered a<br />
clear upswing in <strong>2010</strong>, with a growth of 191 million<br />
tonnes. This was essentially thanks to the strong rise in<br />
coking coal and iron ore imports into China and India.