effect of infection of the filarial parasite brugia malayi - Pondicherry ...
effect of infection of the filarial parasite brugia malayi - Pondicherry ...
effect of infection of the filarial parasite brugia malayi - Pondicherry ...
You also want an ePaper? Increase the reach of your titles
YUMPU automatically turns print PDFs into web optimized ePapers that Google loves.
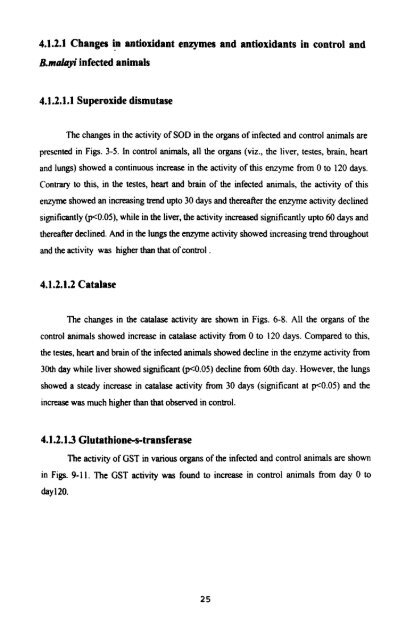
4.1.2.1 Changes in antioxidant enzymes and antioxidants in control and<br />
B.m&yi infected animals<br />
4.1.2.1.1 Superoxide dismutase<br />
The changes in <strong>the</strong> activity <strong>of</strong> SOD in <strong>the</strong> organs <strong>of</strong> infected and control animals are<br />
presented in Figs. 3-5. In control animals, all <strong>the</strong> organs (viz., <strong>the</strong> liver, testes, brain, heart<br />
and lungs) showed a continuous increase in <strong>the</strong> activity <strong>of</strong> this enzyme from 0 to 120 days.<br />
Contrary to this, in <strong>the</strong> testes, heart and brain <strong>of</strong> <strong>the</strong> infected animals, <strong>the</strong> activity <strong>of</strong> this<br />
enzyme showed an increasing trend upto 30 days and <strong>the</strong>reafter <strong>the</strong> enzyme activity declined<br />
s~gn~ficantly w0.05), while in <strong>the</strong> liver, <strong>the</strong> activity increased sigmficantly upto 60 days and<br />
<strong>the</strong>reafkr declined. And in <strong>the</strong> lungs <strong>the</strong> enzyme activity showed increasing trend throughout<br />
and <strong>the</strong> activity was higher than that <strong>of</strong> control .<br />
4.1.2.1.2 Catalase<br />
The changes in <strong>the</strong> catalase activity are shown in Figs. 6-8. All <strong>the</strong> organs <strong>of</strong> <strong>the</strong><br />
control animals showed increase in catalase activity from 0 to 120 days. Compared to this,<br />
<strong>the</strong> tesw, heart and brain <strong>of</strong> <strong>the</strong> infected animals showed decline in <strong>the</strong> enzyme activity from<br />
30th day while liver showed significant m.05) decline from 60th day. However, <strong>the</strong> lungs<br />
showed a steady increase in catalase activity from 30 days (significant at F0.05) and <strong>the</strong><br />
increase was much higher than that observed in control.<br />
4.1.2.13 Clutathione-s-transferase<br />
The activity <strong>of</strong> GST in various organs <strong>of</strong> <strong>the</strong> infected and control animals are shown<br />
in F~gs. 9-1 1. The GST activity was found to increase in control animals from day 0 to<br />
day 120.


