effect of infection of the filarial parasite brugia malayi - Pondicherry ...
effect of infection of the filarial parasite brugia malayi - Pondicherry ...
effect of infection of the filarial parasite brugia malayi - Pondicherry ...
Create successful ePaper yourself
Turn your PDF publications into a flip-book with our unique Google optimized e-Paper software.
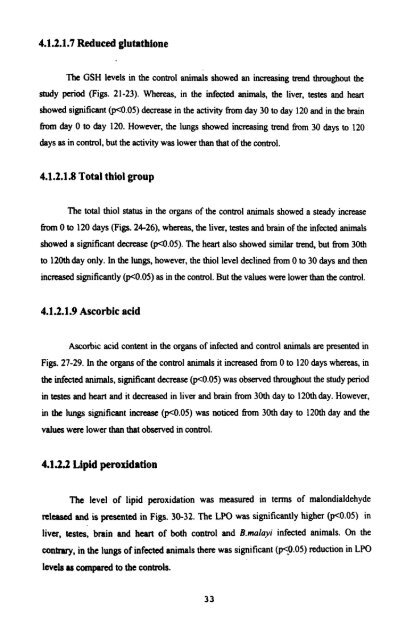
4.1.2.1.7 Reduced glutathione<br />
The GSH levels in <strong>the</strong> control animals showed an increasing trend throughout <strong>the</strong><br />
study period (Figs. 21-23). Whereas, in <strong>the</strong> infected animals, <strong>the</strong> liver, testes and heat<br />
showed significant w0.05) decrease in <strong>the</strong> activity from day 30 to day 120 and in <strong>the</strong> brain<br />
from day 0 to day 120. However, <strong>the</strong> lungs showed increasing trend from 30 days to 120<br />
days as in control, but <strong>the</strong> activity was lower than that <strong>of</strong> <strong>the</strong> control.<br />
4.1.2.1.8 Total thiol group<br />
The total hi01 status in <strong>the</strong> organs <strong>of</strong> <strong>the</strong> control animals showed a steady increase<br />
from 0 to 120 days (Figs. 24-26), whereas, <strong>the</strong> liver, testes and brain <strong>of</strong> <strong>the</strong> infected animals<br />
showed a significant decrease w.05). The heart also showed similar trend, but from 30th<br />
to 120thday only. In <strong>the</strong> lungs, however, <strong>the</strong> thiol level declined from 0 to 30 days and <strong>the</strong>n<br />
increased significantly wO.05) as in <strong>the</strong> control. But <strong>the</strong> values were lower than <strong>the</strong> control.<br />
4.1.2.1.9 Ascorbic acid<br />
Ascorbic acid content in <strong>the</strong> organs <strong>of</strong> mfected and contml animals are pmted in<br />
Figs. 27-29. In <strong>the</strong> organs <strong>of</strong> <strong>the</strong> control animals it increased from 0 to 120 days whereas, in<br />
<strong>the</strong> infected animals, significant decrease w0.05) was observed throughout <strong>the</strong> study pencd<br />
in testes and heart and it decreased in liver and brain from 30th day to 120th day. However,<br />
in <strong>the</strong> lungs significant increase (~~0.05) was noticed from 30th day to 120th day and <strong>the</strong><br />
values were lower than that observed in control.<br />
4.1.23 Lipid peroxidation<br />
The level <strong>of</strong> lipid peroxidation was measured in terms <strong>of</strong> malondialdehyde<br />
released and is presented in Figs. 30-32. The LPO was significantly higher w0.05) in<br />
liver, testes, brain and heart <strong>of</strong> both control and B.m~layc infected animals. On <strong>the</strong><br />
contrary, in <strong>the</strong> lungs <strong>of</strong> infected animals <strong>the</strong>re was significant wO.05) reduction in LPO<br />
levels as compartd to <strong>the</strong> controls.


