


You also want an ePaper? Increase the reach of your titles
YUMPU automatically turns print PDFs into web optimized ePapers that Google loves.
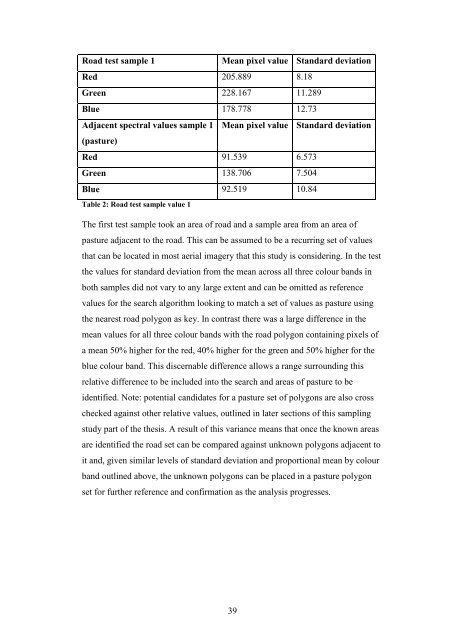
Road test sample 1 Mean pixel value Standard deviation<br />
Red 205.889 8.18<br />
Green 228.167 11.289<br />
Blue 178.778 12.73<br />
Adjacent spectral values sample 1<br />
(pasture)<br />
Mean pixel value Standard deviation<br />
Red 91.539 6.573<br />
Green 138.706 7.504<br />
Blue 92.519 10.84<br />
Table 2: Road test sample value 1<br />
The first test sample took an area of road and a sample area from an area of<br />
pasture adjacent to the road. This can be assumed to be a recurring set of values<br />
that can be located in most aerial imagery that this study is considering. In the test<br />
the values for standard deviation from the mean across all three colour bands in<br />
both samples did not vary to any large extent and can be omitted as reference<br />
values for the search algorithm looking to match a set of values as pasture using<br />
the nearest road polygon as key. In contrast there was a large difference in the<br />
mean values for all three colour bands with the road polygon containing pixels of<br />
a mean 50% higher for the red, 40% higher for the green and 50% higher for the<br />
blue colour band. This discernable difference allows a range surrounding this<br />
relative difference to be included into the search and areas of pasture to be<br />
identified. Note: potential candidates for a pasture set of polygons are also cross<br />
checked against other relative values, outlined in later sections of this sampling<br />
study part of the thesis. A result of this variance means that once the known areas<br />
are identified the road set can be compared against unknown polygons adjacent to<br />
it and, given similar levels of standard deviation and proportional mean by colour<br />
band outlined above, the unknown polygons can be placed in a pasture polygon<br />
set for further reference and confirmation as the analysis progresses.<br />
39


