


You also want an ePaper? Increase the reach of your titles
YUMPU automatically turns print PDFs into web optimized ePapers that Google loves.
3.7 Shade<br />
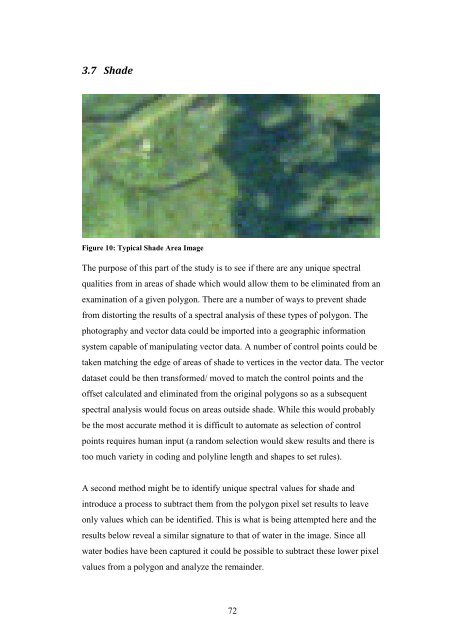
Figure 10: Typical Shade Area Image<br />
The purpose of this part of the study is to see if there are any unique spectral<br />
qualities from in areas of shade which would allow them to be eliminated from an<br />
examination of a given polygon. There are a number of ways to prevent shade<br />
from distorting the results of a spectral analysis of these types of polygon. The<br />
photography and vector data could be imported into a geographic information<br />
system capable of manipulating vector data. A number of control points could be<br />
taken matching the edge of areas of shade to vertices in the vector data. The vector<br />
dataset could be then transformed/ moved to match the control points and the<br />
offset calculated and eliminated from the original polygons so as a subsequent<br />
spectral analysis would focus on areas outside shade. While this would probably<br />
be the most accurate method it is difficult to automate as selection of control<br />
points requires human input (a random selection would skew results and there is<br />
too much variety in coding and polyline length and shapes to set rules).<br />
A second method might be to identify unique spectral values for shade and<br />
introduce a process to subtract them from the polygon pixel set results to leave<br />
only values which can be identified. This is what is being attempted here and the<br />
results below reveal a similar signature to that of water in the image. Since all<br />
water bodies have been captured it could be possible to subtract these lower pixel<br />
values from a polygon and analyze the remainder.<br />
72


