


You also want an ePaper? Increase the reach of your titles
YUMPU automatically turns print PDFs into web optimized ePapers that Google loves.
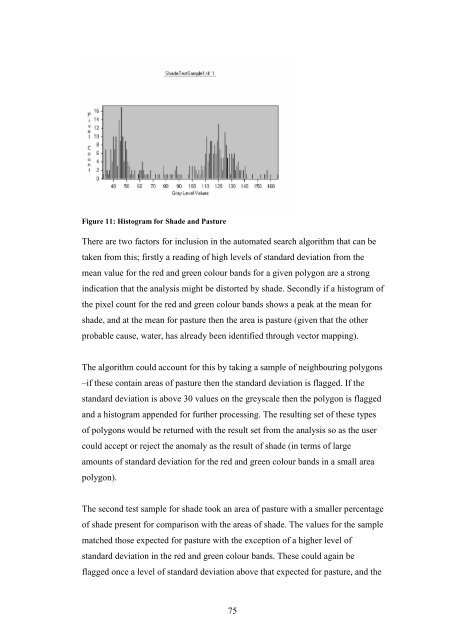
Figure 11: Histogram for Shade and Pasture<br />
There are two factors for inclusion in the automated search algorithm that can be<br />
taken from this; firstly a reading of high levels of standard deviation from the<br />
mean value for the red and green colour bands for a given polygon are a strong<br />
indication that the analysis might be distorted by shade. Secondly if a histogram of<br />
the pixel count for the red and green colour bands shows a peak at the mean for<br />
shade, and at the mean for pasture then the area is pasture (given that the other<br />
probable cause, water, has already been identified through vector mapping).<br />
The algorithm could account for this by taking a sample of neighbouring polygons<br />
–if these contain areas of pasture then the standard deviation is flagged. If the<br />
standard deviation is above 30 values on the greyscale then the polygon is flagged<br />
and a histogram appended for further processing. The resulting set of these types<br />
of polygons would be returned with the result set from the analysis so as the user<br />
could accept or reject the anomaly as the result of shade (in terms of large<br />
amounts of standard deviation for the red and green colour bands in a small area<br />
polygon).<br />
The second test sample for shade took an area of pasture with a smaller percentage<br />
of shade present for comparison with the areas of shade. The values for the sample<br />
matched those expected for pasture with the exception of a higher level of<br />
standard deviation in the red and green colour bands. These could again be<br />
flagged once a level of standard deviation above that expected for pasture, and the<br />
75


