


You also want an ePaper? Increase the reach of your titles
YUMPU automatically turns print PDFs into web optimized ePapers that Google loves.
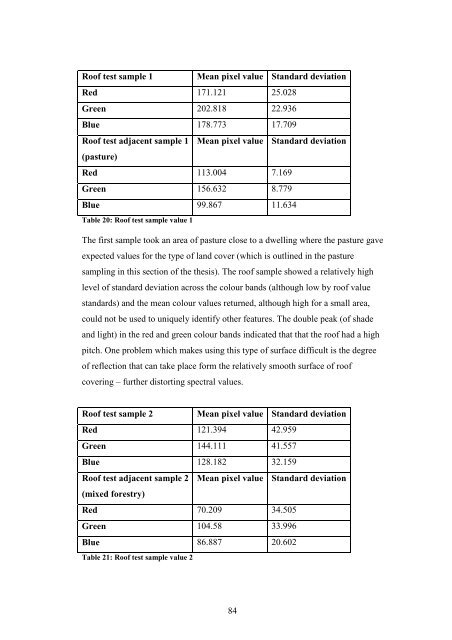
Roof test sample 1 Mean pixel value Standard deviation<br />
Red 171.121 25.028<br />
Green 202.818 22.936<br />
Blue 178.773 17.709<br />
Roof test adjacent sample 1<br />
(pasture)<br />
Mean pixel value Standard deviation<br />
Red 113.004 7.169<br />
Green 156.632 8.779<br />
Blue 99.867 11.634<br />
Table 20: Roof test sample value 1<br />
The first sample took an area of pasture close to a dwelling where the pasture gave<br />
expected values for the type of land cover (which is outlined in the pasture<br />
sampling in this section of the thesis). The roof sample showed a relatively high<br />
level of standard deviation across the colour bands (although low by roof value<br />
standards) and the mean colour values returned, although high for a small area,<br />
could not be used to uniquely identify other features. The double peak (of shade<br />
and light) in the red and green colour bands indicated that that the roof had a high<br />
pitch. One problem which makes using this type of surface difficult is the degree<br />
of reflection that can take place form the relatively smooth surface of roof<br />
covering – further distorting spectral values.<br />
Roof test sample 2 Mean pixel value Standard deviation<br />
Red 121.394 42.959<br />
Green 144.111 41.557<br />
Blue 128.182 32.159<br />
Roof test adjacent sample 2<br />
(mixed forestry)<br />
Mean pixel value Standard deviation<br />
Red 70.209 34.505<br />
Green 104.58 33.996<br />
Blue 86.887 20.602<br />
Table 21: Roof test sample value 2<br />
84


