


You also want an ePaper? Increase the reach of your titles
YUMPU automatically turns print PDFs into web optimized ePapers that Google loves.
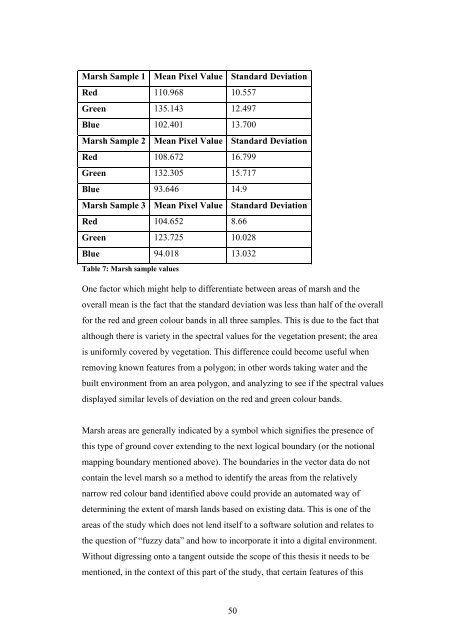
Marsh Sample 1 Mean Pixel Value Standard Deviation<br />
Red 110.968 10.557<br />
Green 135.143 12.497<br />
Blue 102.401 13.700<br />
Marsh Sample 2 Mean Pixel Value Standard Deviation<br />
Red 108.672 16.799<br />
Green 132.305 15.717<br />
Blue 93.646 14.9<br />
Marsh Sample 3 Mean Pixel Value Standard Deviation<br />
Red 104.652 8.66<br />
Green 123.725 10.028<br />
Blue 94.018 13.032<br />
Table 7: Marsh sample values<br />
One factor which might help to differentiate between areas of marsh and the<br />
overall mean is the fact that the standard deviation was less than half of the overall<br />
for the red and green colour bands in all three samples. This is due to the fact that<br />
although there is variety in the spectral values for the vegetation present; the area<br />
is uniformly covered by vegetation. This difference could become useful when<br />
removing known features from a polygon; in other words taking water and the<br />
built environment from an area polygon, and analyzing to see if the spectral values<br />
displayed similar levels of deviation on the red and green colour bands.<br />
Marsh areas are generally indicated by a symbol which signifies the presence of<br />
this type of ground cover extending to the next logical boundary (or the notional<br />
mapping boundary mentioned above). The boundaries in the vector data do not<br />
contain the level marsh so a method to identify the areas from the relatively<br />
narrow red colour band identified above could provide an automated way of<br />
determining the extent of marsh lands based on existing data. This is one of the<br />
areas of the study which does not lend itself to a software solution and relates to<br />
the question of “fuzzy data” and how to incorporate it into a digital environment.<br />
Without digressing onto a tangent outside the scope of this thesis it needs to be<br />
mentioned, in the context of this part of the study, that certain features of this<br />
50


