


Create successful ePaper yourself
Turn your PDF publications into a flip-book with our unique Google optimized e-Paper software.
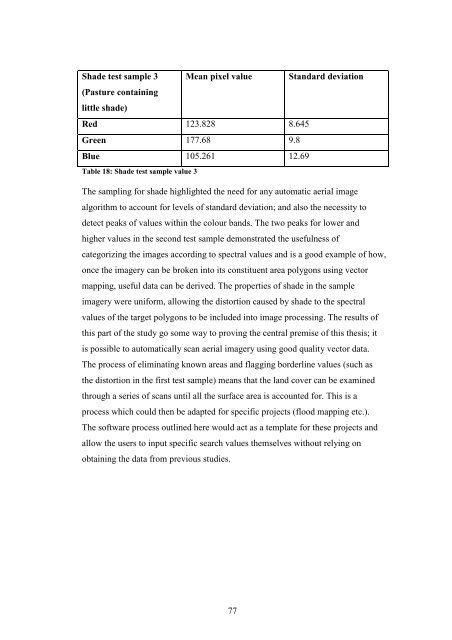
Shade test sample 3<br />
(Pasture containing<br />
little shade)<br />
Mean pixel value Standard deviation<br />
Red 123.828 8.645<br />
Green 177.68 9.8<br />
Blue 105.261 12.69<br />
Table 18: Shade test sample value 3<br />
The sampling for shade highlighted the need for any automatic aerial image<br />
algorithm to account for levels of standard deviation; and also the necessity to<br />
detect peaks of values within the colour bands. The two peaks for lower and<br />
higher values in the second test sample demonstrated the usefulness of<br />
categorizing the images according to spectral values and is a good example of how,<br />
once the imagery can be broken into its constituent area polygons using vector<br />
mapping, useful data can be derived. The properties of shade in the sample<br />
imagery were uniform, allowing the distortion caused by shade to the spectral<br />
values of the target polygons to be included into image processing. The results of<br />
this part of the study go some way to proving the central premise of this thesis; it<br />
is possible to automatically scan aerial imagery using good quality vector data.<br />
The process of eliminating known areas and flagging borderline values (such as<br />
the distortion in the first test sample) means that the land cover can be examined<br />
through a series of scans until all the surface area is accounted for. This is a<br />
process which could then be adapted for specific projects (flood mapping etc.).<br />
The software process outlined here would act as a template for these projects and<br />
allow the users to input specific search values themselves without relying on<br />
obtaining the data from previous studies.<br />
77


