


You also want an ePaper? Increase the reach of your titles
YUMPU automatically turns print PDFs into web optimized ePapers that Google loves.
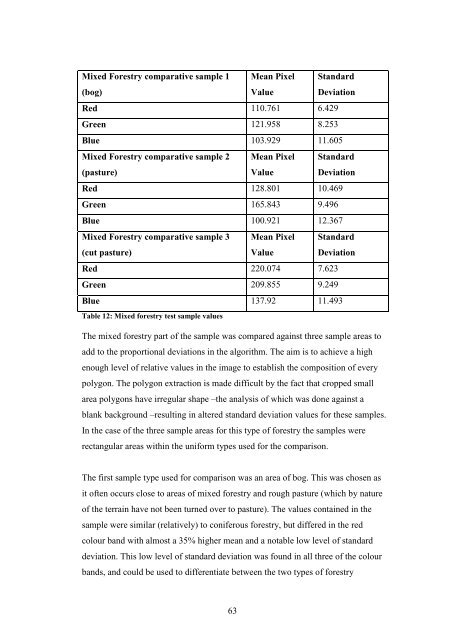
Mixed Forestry comparative sample 1<br />
(bog)<br />
63<br />
Mean Pixel<br />
Value<br />
Standard<br />
Deviation<br />
Red 110.761 6.429<br />
Green 121.958 8.253<br />
Blue 103.929 11.605<br />
Mixed Forestry comparative sample 2<br />
(pasture)<br />
Mean Pixel<br />
Value<br />
Standard<br />
Deviation<br />
Red 128.801 10.469<br />
Green 165.843 9.496<br />
Blue 100.921 12.367<br />
Mixed Forestry comparative sample 3<br />
(cut pasture)<br />
Mean Pixel<br />
Value<br />
Standard<br />
Deviation<br />
Red 220.074 7.623<br />
Green 209.855 9.249<br />
Blue 137.92 11.493<br />
Table 12: Mixed forestry test sample values<br />
The mixed forestry part of the sample was compared against three sample areas to<br />
add to the proportional deviations in the algorithm. The aim is to achieve a high<br />
enough level of relative values in the image to establish the composition of every<br />
polygon. The polygon extraction is made difficult by the fact that cropped small<br />
area polygons have irregular shape –the analysis of which was done against a<br />
blank background –resulting in altered standard deviation values for these samples.<br />
In the case of the three sample areas for this type of forestry the samples were<br />
rectangular areas within the uniform types used for the comparison.<br />
The first sample type used for comparison was an area of bog. This was chosen as<br />
it often occurs close to areas of mixed forestry and rough pasture (which by nature<br />
of the terrain have not been turned over to pasture). The values contained in the<br />
sample were similar (relatively) to coniferous forestry, but differed in the red<br />
colour band with almost a 35% higher mean and a notable low level of standard<br />
deviation. This low level of standard deviation was found in all three of the colour<br />
bands, and could be used to differentiate between the two types of forestry


