2003 Louisiana Vital Statistics Report - Louisiana Department of ...
2003 Louisiana Vital Statistics Report - Louisiana Department of ...
2003 Louisiana Vital Statistics Report - Louisiana Department of ...

You also want an ePaper? Increase the reach of your titles
YUMPU automatically turns print PDFs into web optimized ePapers that Google loves.
<strong>2003</strong> LOUISIANA VITAL STATISTICS REPORT INFANT AND MATERNAL MORTALITY<br />
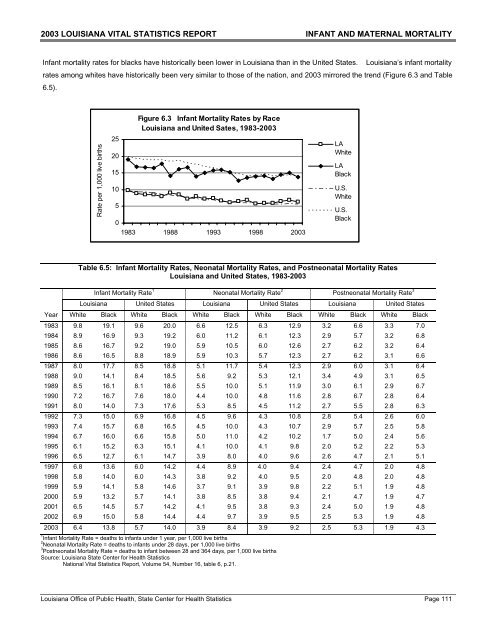
Infant mortality rates for blacks have historically been lower in <strong>Louisiana</strong> than in the United States. <strong>Louisiana</strong>’s infant mortality<br />
rates among whites have historically been very similar to those <strong>of</strong> the nation, and <strong>2003</strong> mirrored the trend (Figure 6.3 and Table<br />
6.5).<br />
Rate per 1,000 live births<br />
25<br />
20<br />
15<br />
10<br />
5<br />
Figure 6.3 Infant Mortality Rates by Race<br />
<strong>Louisiana</strong> and United Sates, 1983-<strong>2003</strong><br />
0<br />
1983 1988 1993 1998 <strong>2003</strong><br />
Table 6.5: Infant Mortality Rates, Neonatal Mortality Rates, and Postneonatal Mortality Rates<br />
<strong>Louisiana</strong> and United States, 1983-<strong>2003</strong><br />
Infant Mortality Rate 1 Neonatal Mortality Rate 2 Postneonatal Mortality Rate 3<br />
<strong>Louisiana</strong> United States <strong>Louisiana</strong> United States <strong>Louisiana</strong> United States<br />
Year White Black White Black White Black White Black White Black White Black<br />
1983 9.8 19.1 9.6 20.0 6.6 12.5 6.3 12.9 3.2 6.6 3.3 7.0<br />
1984 8.9 16.9 9.3 19.2 6.0 11.2 6.1 12.3 2.9 5.7 3.2 6.8<br />
1985 8.6 16.7 9.2 19.0 5.9 10.5 6.0 12.6 2.7 6.2 3.2 6.4<br />
1986 8.6 16.5 8.8 18.9 5.9 10.3 5.7 12.3 2.7 6.2 3.1 6.6<br />
1987 8.0 17.7 8.5 18.8 5.1 11.7 5.4 12.3 2.9 6.0 3.1 6.4<br />
1988 9.0 14.1 8.4 18.5 5.6 9.2 5.3 12.1 3.4 4.9 3.1 6.5<br />
1989 8.5 16.1 8.1 18.6 5.5 10.0 5.1 11.9 3.0 6.1 2.9 6.7<br />
1990 7.2 16.7 7.6 18.0 4.4 10.0 4.8 11.6 2.8 6.7 2.8 6.4<br />
1991 8.0 14.0 7.3 17.6 5.3 8.5 4.5 11.2 2.7 5.5 2.8 6.3<br />
1992 7.3 15.0 6.9 16.8 4.5 9.6 4.3 10.8 2.8 5.4 2.6 6.0<br />
1993 7.4 15.7 6.8 16.5 4.5 10.0 4.3 10.7 2.9 5.7 2.5 5.8<br />
1994 6.7 16.0 6.6 15.8 5.0 11.0 4.2 10.2 1.7 5.0 2.4 5.6<br />
1995 6.1 15.2 6.3 15.1 4.1 10.0 4.1 9.8 2.0 5.2 2.2 5.3<br />
1996 6.5 12.7 6.1 14.7 3.9 8.0 4.0 9.6 2.6 4.7 2.1 5.1<br />
1997 6.8 13.6 6.0 14.2 4.4 8.9 4.0 9.4 2.4 4.7 2.0 4.8<br />
1998 5.8 14.0 6.0 14.3 3.8 9.2 4.0 9.5 2.0 4.8 2.0 4.8<br />
1999 5.9 14.1 5.8 14.6 3.7 9.1 3.9 9.8 2.2 5.1 1.9 4.8<br />
2000 5.9 13.2 5.7 14.1 3.8 8.5 3.8 9.4 2.1 4.7 1.9 4.7<br />
2001 6.5 14.5 5.7 14.2 4.1 9.5 3.8 9.3 2.4 5.0 1.9 4.8<br />
2002 6.9 15.0 5.8 14.4 4.4 9.7 3.9 9.5 2.5 5.3 1.9 4.8<br />
<strong>2003</strong> 6.4 13.8 5.7 14.0 3.9 8.4 3.9 9.2 2.5 5.3 1.9 4.3<br />
1 Infant Mortality Rate = deaths to infants under 1 year, per 1,000 live births<br />
2 Neonatal Mortality Rate = deaths to infants under 28 days, per 1,000 live births<br />
3 Postneonatal Mortality Rate = deaths to infant between 28 and 364 days, per 1,000 live births<br />
Source: <strong>Louisiana</strong> State Center for Health <strong>Statistics</strong><br />
National <strong>Vital</strong> <strong>Statistics</strong> <strong>Report</strong>, Volume 54, Number 16, table 6, p.21.<br />
<strong>Louisiana</strong> Office <strong>of</strong> Public Health, State Center for Health <strong>Statistics</strong> Page 111<br />
LA<br />
White<br />
LA<br />
Black<br />
U.S.<br />
White<br />
U.S.<br />
Black