2003 Louisiana Vital Statistics Report - Louisiana Department of ...
2003 Louisiana Vital Statistics Report - Louisiana Department of ...
2003 Louisiana Vital Statistics Report - Louisiana Department of ...

Create successful ePaper yourself
Turn your PDF publications into a flip-book with our unique Google optimized e-Paper software.
MARRIAGE AND DIVORCE <strong>2003</strong> LOUISIANA VITAL STATISTICS REPORT<br />
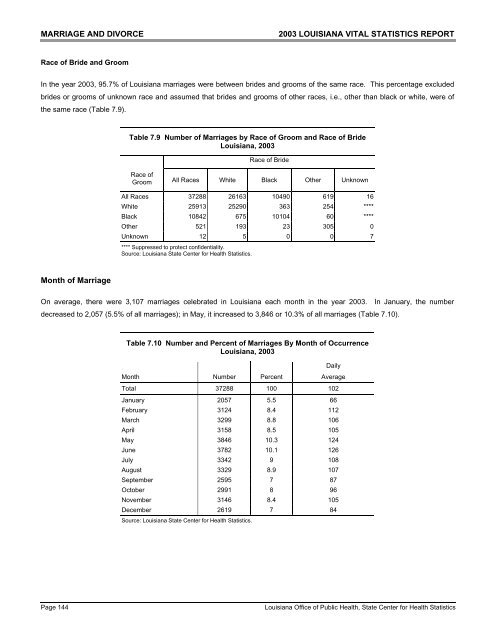
Race <strong>of</strong> Bride and Groom<br />
In the year <strong>2003</strong>, 95.7% <strong>of</strong> <strong>Louisiana</strong> marriages were between brides and grooms <strong>of</strong> the same race. This percentage excluded<br />
brides or grooms <strong>of</strong> unknown race and assumed that brides and grooms <strong>of</strong> other races, i.e., other than black or white, were <strong>of</strong><br />
the same race (Table 7.9).<br />
Month <strong>of</strong> Marriage<br />
Table 7.9 Number <strong>of</strong> Marriages by Race <strong>of</strong> Groom and Race <strong>of</strong> Bride<br />
<strong>Louisiana</strong>, <strong>2003</strong><br />
Race <strong>of</strong><br />
Groom<br />
All Races<br />
White<br />
Race <strong>of</strong> Bride<br />
Page 144 <strong>Louisiana</strong> Office <strong>of</strong> Public Health, State Center for Health <strong>Statistics</strong><br />
Black<br />
Other<br />
Unknown<br />
All Races 37288 26163 10490 619 16<br />
White 25913 25290 363 254 ****<br />
Black 10842 675 10104 60 ****<br />
Other 521 193 23 305 0<br />
Unknown 12 5 0 0 7<br />
**** Suppressed to protect confidentiality.<br />
Source: <strong>Louisiana</strong> State Center for Health <strong>Statistics</strong>.<br />
On average, there were 3,107 marriages celebrated in <strong>Louisiana</strong> each month in the year <strong>2003</strong>. In January, the number<br />
decreased to 2,057 (5.5% <strong>of</strong> all marriages); in May, it increased to 3,846 or 10.3% <strong>of</strong> all marriages (Table 7.10).<br />
Table 7.10 Number and Percent <strong>of</strong> Marriages By Month <strong>of</strong> Occurrence<br />
<strong>Louisiana</strong>, <strong>2003</strong><br />
Daily<br />
Month Number Percent Average<br />
Total 37288 100 102<br />
January 2057 5.5 66<br />
February 3124 8.4 112<br />
March 3299 8.8 106<br />
April 3158 8.5 105<br />
May 3846 10.3 124<br />
June 3782 10.1 126<br />
July 3342 9 108<br />
August 3329 8.9 107<br />
September 2595 7 87<br />
October 2991 8 96<br />
November 3146 8.4 105<br />
December 2619 7 84<br />
Source: <strong>Louisiana</strong> State Center for Health <strong>Statistics</strong>.