2003 Louisiana Vital Statistics Report - Louisiana Department of ...
2003 Louisiana Vital Statistics Report - Louisiana Department of ...
2003 Louisiana Vital Statistics Report - Louisiana Department of ...

Create successful ePaper yourself
Turn your PDF publications into a flip-book with our unique Google optimized e-Paper software.
Other<br />
LIVE BIRTHS <strong>2003</strong> LOUISIANA VITAL STATISTICS REPORT<br />
Unknown<br />
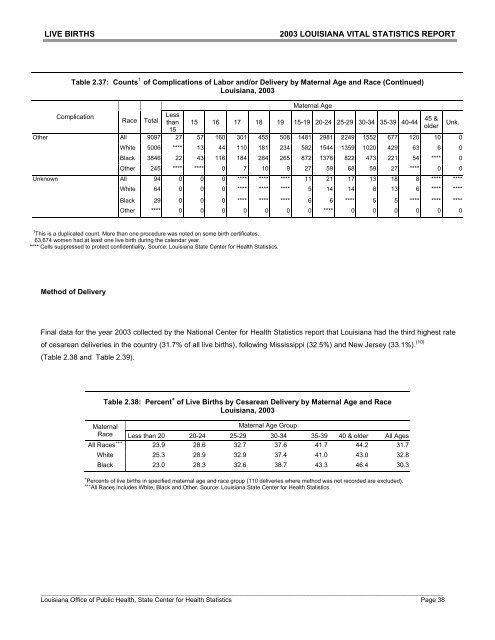
Table 2.37: Counts 1 <strong>of</strong> Complications <strong>of</strong> Labor and/or Delivery by Maternal Age and Race (Continued)<br />
<strong>Louisiana</strong>, <strong>2003</strong><br />
Complication<br />
Race<br />
Total Less<br />
than<br />
15<br />
Maternal Age<br />
15 16 17 18 19 15-19 20-24 25-29 30-34 35-39 40-44<br />
45 &<br />
older Unk.<br />
All 9097 27 57 160 301 455 508 1481 2981 2249 1552 677 120 10 0<br />
White 5006 **** 13 44 110 181 234 582 1544 1359 1020 429 63 6 0<br />
Black 3846 22 43 116 184 264 265 872 1378 822 473 221 54 **** 0<br />
Other 245 **** **** 0 7 10 9 27 59 68 59 27 **** 0 0<br />
All 94 0 0 0 **** **** **** 11 21 17 13 18 8 **** ****<br />
White 64 0 0 0 **** **** **** 5 14 14 8 13 6 **** ****<br />
Black 29 0 0 0 **** **** **** 6 6 **** 5 5 **** **** ****<br />
Other **** 0 0 0 0 0 0 0 **** 0 0 0 0 0 0<br />
1 This is a duplicated count. More than one procedure was noted on some birth certificates.<br />
63,674 women had at least one live birth during the calendar year.<br />
**** Cells suppressed to protect confidentiality. Source: <strong>Louisiana</strong> State Center for Health <strong>Statistics</strong>.<br />
Method <strong>of</strong> Delivery<br />
Final data for the year <strong>2003</strong> collected by the National Center for Health <strong>Statistics</strong> report that <strong>Louisiana</strong> had the third highest rate<br />
<strong>of</strong> cesarean deliveries in the country (31.7% <strong>of</strong> all live births), following Mississippi (32.5%) and New Jersey (33.1%). (10)<br />
(Table 2.38 and Table 2.39).<br />
Table 2.38: Percent + <strong>of</strong> Live Births by Cesarean Delivery by Maternal Age and Race<br />
<strong>Louisiana</strong>, <strong>2003</strong><br />
Maternal<br />
Maternal Age Group<br />
Race Less than 20 20-24 25-29 30-34 35-39 40 & older All Ages<br />
All Races +++ 23.9 28.6 32.7 37.6 41.7 44.2 31.7<br />
White<br />
25.3 28.9 32.9 37.4 41.0 43.0 32.8<br />
Black 23.0 28.3 32.6 38.7 43.3 46.4 30.3<br />
+ Percents <strong>of</strong> live births in specified maternal age and race group (110 deliveries where method was not recorded are excluded).<br />
+++ All Races includes White, Black and Other. Source: <strong>Louisiana</strong> State Center for Health <strong>Statistics</strong>.<br />
________________________________________________________________________________________________________________<br />
<strong>Louisiana</strong> Office <strong>of</strong> Public Health, State Center for Health <strong>Statistics</strong> Page 38