2003 Louisiana Vital Statistics Report - Louisiana Department of ...
2003 Louisiana Vital Statistics Report - Louisiana Department of ...
2003 Louisiana Vital Statistics Report - Louisiana Department of ...

Create successful ePaper yourself
Turn your PDF publications into a flip-book with our unique Google optimized e-Paper software.
<strong>2003</strong> LOUISIANA VITAL STATISTICS REPORT FETAL DEATHS<br />
Year<br />
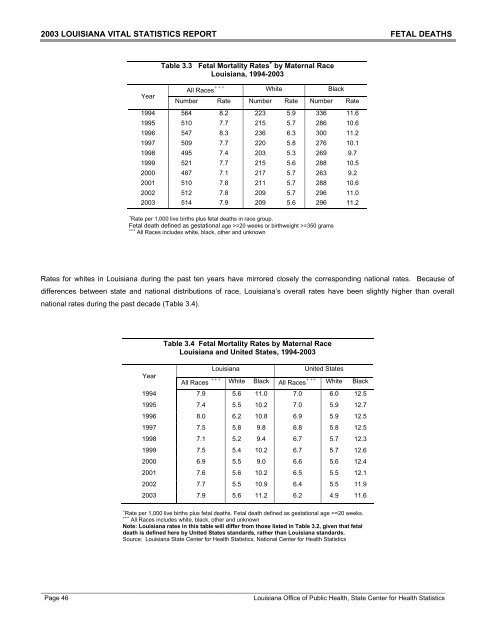
Table 3.3 Fetal Mortality Rates + by Maternal Race<br />
<strong>Louisiana</strong>, 1994-<strong>2003</strong><br />
All Races +++ White Black<br />
Number Rate Number Rate Number Rate<br />
1994 564 8.2 223 5.9 336 11.6<br />
1995 510 7.7 215 5.7 286 10.6<br />
1996 547 8.3 236 6.3 300 11.2<br />
1997 509 7.7 220 5.8 276 10.1<br />
1998 495 7.4 203 5.3 269 9.7<br />
1999 521 7.7 215 5.6 288 10.5<br />
2000 487 7.1 217 5.7 263 9.2<br />
2001 510 7.8 211 5.7 288 10.6<br />
2002 512 7.8 209 5.7 296 11.0<br />
<strong>2003</strong> 514 7.9 209 5.6 296 11.2<br />
+ Rate per 1,000 live births plus fetal deaths in race group.<br />
Fetal death defined as gestational age >=20 weeks or birthweight >=350 grams<br />
+++ All Races includes white, black, other and unknown<br />
Rates for whites in <strong>Louisiana</strong> during the past ten years have mirrored closely the corresponding national rates. Because <strong>of</strong><br />
differences between state and national distributions <strong>of</strong> race, <strong>Louisiana</strong>’s overall rates have been slightly higher than overall<br />
national rates during the past decade (Table 3.4).<br />
Year<br />
Table 3.4 Fetal Mortality Rates by Maternal Race<br />
<strong>Louisiana</strong> and United States, 1994-<strong>2003</strong><br />
<strong>Louisiana</strong> United States<br />
All Races +++ White Black All Races +++ White Black<br />
1994 7.9 5.6 11.0 7.0 6.0 12.5<br />
1995 7.4 5.5 10.2 7.0 5.9 12.7<br />
1996 8.0 6.2 10.8 6.9 5.9 12.5<br />
1997 7.5 5.8 9.8 6.8 5.8 12.5<br />
1998 7.1 5.2 9.4 6.7 5.7 12.3<br />
1999 7.5 5.4 10.2 6.7 5.7 12.6<br />
2000 6.9 5.5 9.0 6.6 5.6 12.4<br />
2001 7.6 5.6 10.2 6.5 5.5 12.1<br />
2002 7.7 5.5 10.9 6.4 5.5 11.9<br />
<strong>2003</strong> 7.9 5.6 11.2 6.2 4.9 11.6<br />
+ Rate per 1,000 live births plus fetal deaths. Fetal death defined as gestational age >=20 weeks.<br />
+++ All Races includes white, black, other and unknown<br />
Note: <strong>Louisiana</strong> rates in this table will differ from those listed in Table 3.2, given that fetal<br />
death is defined here by United States standards, rather than <strong>Louisiana</strong> standards.<br />
Source: <strong>Louisiana</strong> State Center for Health <strong>Statistics</strong>, National Center for Health <strong>Statistics</strong><br />
____________________________________________________________________________________________________<br />
Page 46 <strong>Louisiana</strong> Office <strong>of</strong> Public Health, State Center for Health <strong>Statistics</strong>