Livelihood Security: Climate change, conflict and migration in - UNEP
Livelihood Security: Climate change, conflict and migration in - UNEP
Livelihood Security: Climate change, conflict and migration in - UNEP

Create successful ePaper yourself
Turn your PDF publications into a flip-book with our unique Google optimized e-Paper software.
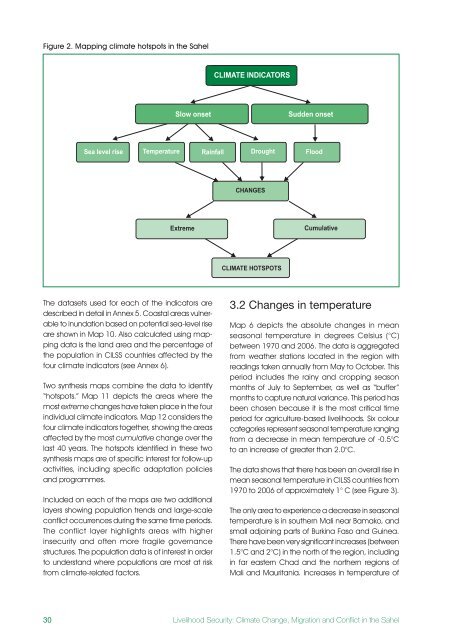
Figure 2 . Mapp<strong>in</strong>g climate hotspots <strong>in</strong> the Sahel<br />
The datasets used for each of the <strong>in</strong>dicators are<br />
described <strong>in</strong> detail <strong>in</strong> Annex 5. Coastal areas vulnerable<br />
to <strong>in</strong>undation based on potential sea-level rise<br />
are shown <strong>in</strong> Map 10. Also calculated us<strong>in</strong>g mapp<strong>in</strong>g<br />
data is the l<strong>and</strong> area <strong>and</strong> the percentage of<br />
the population <strong>in</strong> CILSS countries affected by the<br />
four climate <strong>in</strong>dicators (see Annex 6).<br />
Two synthesis maps comb<strong>in</strong>e the data to identify<br />
“hotspots.” Map 11 depicts the areas where the<br />
most extreme <strong>change</strong>s have taken place <strong>in</strong> the four<br />
<strong>in</strong>dividual climate <strong>in</strong>dicators. Map 12 considers the<br />
four climate <strong>in</strong>dicators together, show<strong>in</strong>g the areas<br />
affected by the most cumulative <strong>change</strong> over the<br />
last 40 years. The hotspots identified <strong>in</strong> these two<br />
synthesis maps are of specific <strong>in</strong>terest for follow-up<br />
activities, <strong>in</strong>clud<strong>in</strong>g specific adaptation policies<br />
<strong>and</strong> programmes.<br />
Included on each of the maps are two additional<br />
layers show<strong>in</strong>g population trends <strong>and</strong> large-scale<br />
<strong>conflict</strong> occurrences dur<strong>in</strong>g the same time periods.<br />
The <strong>conflict</strong> layer highlights areas with higher<br />
<strong>in</strong>security <strong>and</strong> often more fragile governance<br />
structures. The population data is of <strong>in</strong>terest <strong>in</strong> order<br />
to underst<strong>and</strong> where populations are most at risk<br />
from climate-related factors.<br />
30<br />
CLIMATE INDICATORS<br />
Slow onset Sudden onset<br />
Sea level rise Temperature Ra<strong>in</strong>fall Drought Flood<br />
CHANGES<br />
Extreme Cumulative<br />
CLIMATE HOTSPOTS<br />
3.2 Changes <strong>in</strong> temperature<br />
Map 6 depicts the absolute <strong>change</strong>s <strong>in</strong> mean<br />
seasonal temperature <strong>in</strong> degrees Celsius (°C)<br />
between 1970 <strong>and</strong> 2006. The data is aggregated<br />
from weather stations located <strong>in</strong> the region with<br />
read<strong>in</strong>gs taken annually from May to October. This<br />
period <strong>in</strong>cludes the ra<strong>in</strong>y <strong>and</strong> cropp<strong>in</strong>g season<br />
months of July to September, as well as “buffer”<br />
months to capture natural variance. This period has<br />
been chosen because it is the most critical time<br />
period for agriculture-based livelihoods. Six colour<br />
categories represent seasonal temperature rang<strong>in</strong>g<br />
from a decrease <strong>in</strong> mean temperature of -0.5°C<br />
to an <strong>in</strong>crease of greater than 2.0°C.<br />
The data shows that there has been an overall rise <strong>in</strong><br />
mean seasonal temperature <strong>in</strong> CILSS countries from<br />
1970 to 2006 of approximately 1° C (see Figure 3).<br />
The only area to experience a decrease <strong>in</strong> seasonal<br />
temperature is <strong>in</strong> southern Mali near Bamako, <strong>and</strong><br />
small adjo<strong>in</strong><strong>in</strong>g parts of Burk<strong>in</strong>a Faso <strong>and</strong> Gu<strong>in</strong>ea.<br />
There have been very significant <strong>in</strong>creases (between<br />
1.5°C <strong>and</strong> 2°C) <strong>in</strong> the north of the region, <strong>in</strong>clud<strong>in</strong>g<br />
<strong>in</strong> far eastern Chad <strong>and</strong> the northern regions of<br />
Mali <strong>and</strong> Mauritania. Increases <strong>in</strong> temperature of<br />
<strong>Livelihood</strong> <strong>Security</strong>: <strong>Climate</strong> Change, Migration <strong>and</strong> Conflict <strong>in</strong> the Sahel