Livelihood Security: Climate change, conflict and migration in - UNEP
Livelihood Security: Climate change, conflict and migration in - UNEP
Livelihood Security: Climate change, conflict and migration in - UNEP

You also want an ePaper? Increase the reach of your titles
YUMPU automatically turns print PDFs into web optimized ePapers that Google loves.
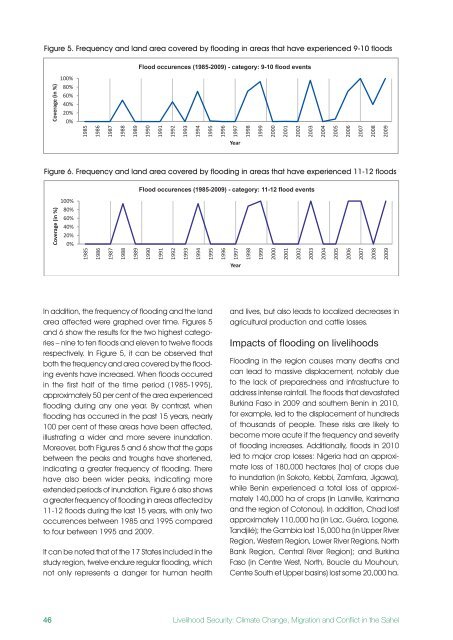
Figure 5 . Frequency <strong>and</strong> l<strong>and</strong> area covered by flood<strong>in</strong>g <strong>in</strong> areas that have experienced 9-10 floods<br />
In addition, the frequency of flood<strong>in</strong>g <strong>and</strong> the l<strong>and</strong><br />
area affected were graphed over time. Figures 5<br />
<strong>and</strong> 6 show the results for the two highest categories<br />
– n<strong>in</strong>e to ten floods <strong>and</strong> eleven to twelve floods<br />
respectively. In Figure 5, it can be observed that<br />
both the frequency <strong>and</strong> area covered by the flood<strong>in</strong>g<br />
events have <strong>in</strong>creased. When floods occurred<br />
<strong>in</strong> the first half of the time period (1985-1995),<br />
approximately 50 per cent of the area experienced<br />
flood<strong>in</strong>g dur<strong>in</strong>g any one year. By contrast, when<br />
flood<strong>in</strong>g has occurred <strong>in</strong> the past 15 years, nearly<br />
100 per cent of these areas have been affected,<br />
illustrat<strong>in</strong>g a wider <strong>and</strong> more severe <strong>in</strong>undation.<br />
Moreover, both Figures 5 <strong>and</strong> 6 show that the gaps<br />
between the peaks <strong>and</strong> troughs have shortened,<br />
<strong>in</strong>dicat<strong>in</strong>g a greater frequency of flood<strong>in</strong>g. There<br />
have also been wider peaks, <strong>in</strong>dicat<strong>in</strong>g more<br />
extended periods of <strong>in</strong>undation. Figure 6 also shows<br />
a greater frequency of flood<strong>in</strong>g <strong>in</strong> areas affected by<br />
11-12 floods dur<strong>in</strong>g the last 15 years, with only two<br />
occurrences between 1985 <strong>and</strong> 1995 compared<br />
to four between 1995 <strong>and</strong> 2009.<br />
It can be noted that of the 17 States <strong>in</strong>cluded <strong>in</strong> the<br />
study region, twelve endure regular flood<strong>in</strong>g, which<br />
not only represents a danger for human health<br />
46<br />
Coverage (<strong>in</strong> %)<br />
Figure 6 . Frequency <strong>and</strong> l<strong>and</strong> area covered by flood<strong>in</strong>g <strong>in</strong> areas that have experienced 11-12 floods<br />
Coverage (<strong>in</strong> %)<br />
100%<br />
80%<br />
60%<br />
40%<br />
20%<br />
0%<br />
100%<br />
80%<br />
60%<br />
40%<br />
20%<br />
0%<br />
1985<br />
1985<br />
1986<br />
1986<br />
1987<br />
1987<br />
1988<br />
1988<br />
1989<br />
1989<br />
Flood occurences (1985-2009) - category: 9-10 flood events<br />
1990<br />
1991<br />
1992<br />
1993<br />
1994<br />
1995<br />
1996<br />
1997<br />
Year<br />
Flood occurences (1985-2009) - category: 11-12 flood events<br />
1990<br />
1991<br />
1992<br />
1993<br />
1994<br />
1995<br />
1996<br />
1997<br />
Year<br />
1998<br />
1998<br />
1999<br />
1999<br />
2000<br />
2000<br />
2001<br />
2001<br />
<strong>and</strong> lives, but also leads to localized decreases <strong>in</strong><br />
agricultural production <strong>and</strong> cattle losses.<br />
Impacts of flood<strong>in</strong>g on livelihoods<br />
Flood<strong>in</strong>g <strong>in</strong> the region causes many deaths <strong>and</strong><br />
can lead to massive displacement, notably due<br />
to the lack of preparedness <strong>and</strong> <strong>in</strong>frastructure to<br />
address <strong>in</strong>tense ra<strong>in</strong>fall. The floods that devastated<br />
Burk<strong>in</strong>a Faso <strong>in</strong> 2009 <strong>and</strong> southern Ben<strong>in</strong> <strong>in</strong> 2010,<br />
for example, led to the displacement of hundreds<br />
of thous<strong>and</strong>s of people. These risks are likely to<br />
become more acute if the frequency <strong>and</strong> severity<br />
of flood<strong>in</strong>g <strong>in</strong>creases. Additionally, floods <strong>in</strong> 2010<br />
led to major crop losses: Nigeria had an approximate<br />
loss of 180,000 hectares (ha) of crops due<br />
to <strong>in</strong>undation (<strong>in</strong> Sokoto, Kebbi, Zamfara, Jigawa),<br />
while Ben<strong>in</strong> experienced a total loss of approximately<br />
140,000 ha of crops (<strong>in</strong> Lanville, Karimana<br />
<strong>and</strong> the region of Cotonou). In addition, Chad lost<br />
approximately 110,000 ha (<strong>in</strong> Lac, Guéra, Logone,<br />
T<strong>and</strong>jilé); the Gambia lost 15,000 ha (<strong>in</strong> Upper River<br />
Region, Western Region, Lower River Regions, North<br />
Bank Region, Central River Region); <strong>and</strong> Burk<strong>in</strong>a<br />
Faso (<strong>in</strong> Centre West, North, Boucle du Mouhoun,<br />
Centre South et Upper bas<strong>in</strong>s) lost some 20,000 ha.<br />
<strong>Livelihood</strong> <strong>Security</strong>: <strong>Climate</strong> Change, Migration <strong>and</strong> Conflict <strong>in</strong> the Sahel<br />
2002<br />
2002<br />
2003<br />
2003<br />
2004<br />
2004<br />
2005<br />
2005<br />
2006<br />
2006<br />
2007<br />
2007<br />
2008<br />
2008<br />
2009<br />
2009