Using the FONIX 7000 to Verify Coupler and Real-Ear Performance ...
Using the FONIX 7000 to Verify Coupler and Real-Ear Performance ...
Using the FONIX 7000 to Verify Coupler and Real-Ear Performance ...

You also want an ePaper? Increase the reach of your titles
YUMPU automatically turns print PDFs into web optimized ePapers that Google loves.
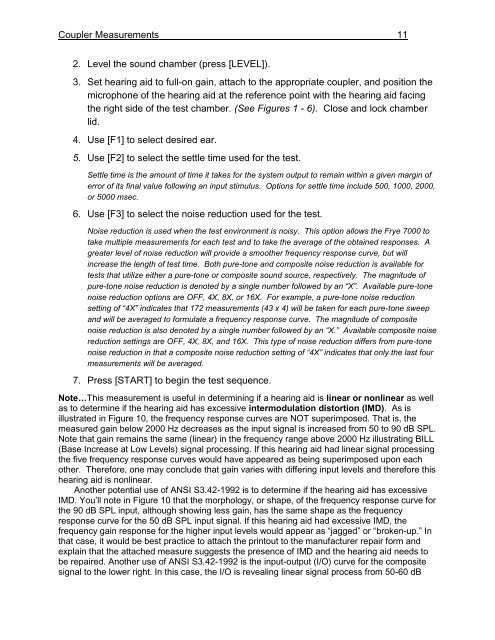
<strong>Coupler</strong> Measurements 11<br />
2. Level <strong>the</strong> sound chamber (press [LEVEL]).<br />
3. Set hearing aid <strong>to</strong> full-on gain, attach <strong>to</strong> <strong>the</strong> appropriate coupler, <strong>and</strong> position <strong>the</strong><br />
microphone of <strong>the</strong> hearing aid at <strong>the</strong> reference point with <strong>the</strong> hearing aid facing<br />
<strong>the</strong> right side of <strong>the</strong> test chamber. (See Figures 1 - 6). Close <strong>and</strong> lock chamber<br />
lid.<br />
4. Use [F1] <strong>to</strong> select desired ear.<br />
5. Use [F2] <strong>to</strong> select <strong>the</strong> settle time used for <strong>the</strong> test.<br />
Settle time is <strong>the</strong> amount of time it takes for <strong>the</strong> system output <strong>to</strong> remain within a given margin of<br />
error of its final value following an input stimulus. Options for settle time include 500, 1000, 2000,<br />
or 5000 msec.<br />
6. Use [F3] <strong>to</strong> select <strong>the</strong> noise reduction used for <strong>the</strong> test.<br />
Noise reduction is used when <strong>the</strong> test environment is noisy. This option allows <strong>the</strong> Frye <strong>7000</strong> <strong>to</strong><br />
take multiple measurements for each test <strong>and</strong> <strong>to</strong> take <strong>the</strong> average of <strong>the</strong> obtained responses. A<br />
greater level of noise reduction will provide a smoo<strong>the</strong>r frequency response curve, but will<br />
increase <strong>the</strong> length of test time. Both pure-<strong>to</strong>ne <strong>and</strong> composite noise reduction is available for<br />
tests that utilize ei<strong>the</strong>r a pure-<strong>to</strong>ne or composite sound source, respectively. The magnitude of<br />
pure-<strong>to</strong>ne noise reduction is denoted by a single number followed by an “X”. Available pure-<strong>to</strong>ne<br />
noise reduction options are OFF, 4X, 8X, or 16X. For example, a pure-<strong>to</strong>ne noise reduction<br />
setting of “4X” indicates that 172 measurements (43 x 4) will be taken for each pure-<strong>to</strong>ne sweep<br />
<strong>and</strong> will be averaged <strong>to</strong> formulate a frequency response curve. The magnitude of composite<br />
noise reduction is also denoted by a single number followed by an “X.” Available composite noise<br />
reduction settings are OFF, 4X, 8X, <strong>and</strong> 16X. This type of noise reduction differs from pure-<strong>to</strong>ne<br />
noise reduction in that a composite noise reduction setting of “4X” indicates that only <strong>the</strong> last four<br />
measurements will be averaged.<br />
7. Press [START] <strong>to</strong> begin <strong>the</strong> test sequence.<br />
Note…This measurement is useful in determining if a hearing aid is linear or nonlinear as well<br />
as <strong>to</strong> determine if <strong>the</strong> hearing aid has excessive intermodulation dis<strong>to</strong>rtion (IMD). As is<br />
illustrated in Figure 10, <strong>the</strong> frequency response curves are NOT superimposed. That is, <strong>the</strong><br />
measured gain below 2000 Hz decreases as <strong>the</strong> input signal is increased from 50 <strong>to</strong> 90 dB SPL.<br />
Note that gain remains <strong>the</strong> same (linear) in <strong>the</strong> frequency range above 2000 Hz illustrating BILL<br />
(Base Increase at Low Levels) signal processing. If this hearing aid had linear signal processing<br />
<strong>the</strong> five frequency response curves would have appeared as being superimposed upon each<br />
o<strong>the</strong>r. Therefore, one may conclude that gain varies with differing input levels <strong>and</strong> <strong>the</strong>refore this<br />
hearing aid is nonlinear.<br />
Ano<strong>the</strong>r potential use of ANSI S3.42-1992 is <strong>to</strong> determine if <strong>the</strong> hearing aid has excessive<br />
IMD. You’ll note in Figure 10 that <strong>the</strong> morphology, or shape, of <strong>the</strong> frequency response curve for<br />
<strong>the</strong> 90 dB SPL input, although showing less gain, has <strong>the</strong> same shape as <strong>the</strong> frequency<br />
response curve for <strong>the</strong> 50 dB SPL input signal. If this hearing aid had excessive IMD, <strong>the</strong><br />
frequency gain response for <strong>the</strong> higher input levels would appear as “jagged” or “broken-up.” In<br />
that case, it would be best practice <strong>to</strong> attach <strong>the</strong> prin<strong>to</strong>ut <strong>to</strong> <strong>the</strong> manufacturer repair form <strong>and</strong><br />
explain that <strong>the</strong> attached measure suggests <strong>the</strong> presence of IMD <strong>and</strong> <strong>the</strong> hearing aid needs <strong>to</strong><br />
be repaired. Ano<strong>the</strong>r use of ANSI S3.42-1992 is <strong>the</strong> input-output (I/O) curve for <strong>the</strong> composite<br />
signal <strong>to</strong> <strong>the</strong> lower right. In this case, <strong>the</strong> I/O is revealing linear signal process from 50-60 dB