analysis of a pilot-scale anaerobic baffled reactor treating domestic ...
analysis of a pilot-scale anaerobic baffled reactor treating domestic ...
analysis of a pilot-scale anaerobic baffled reactor treating domestic ...

Create successful ePaper yourself
Turn your PDF publications into a flip-book with our unique Google optimized e-Paper software.
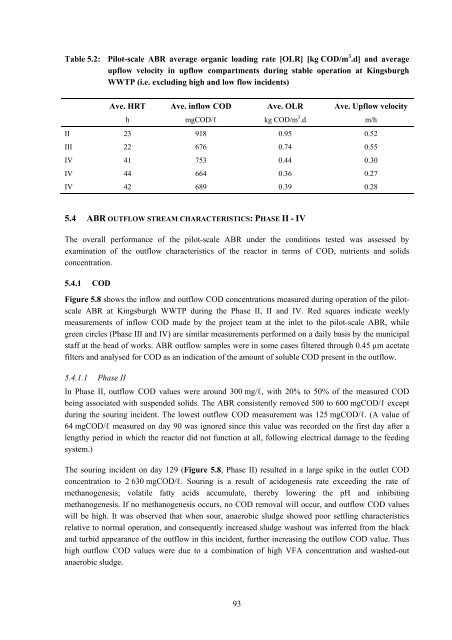
Table 5.2: Pilot-<strong>scale</strong> ABR average organic loading rate [OLR] [kg COD/m 3 .d] and average<br />
upflow velocity in upflow compartments during stable operation at Kingsburgh<br />
WWTP (i.e. excluding high and low flow incidents)<br />
Ave. HRT Ave. inflow COD Ave. OLR Ave. Upflow velocity<br />
h mgCOD/ℓ kg COD/m 3 .d m/h<br />
II 23 918 0.95 0.52<br />
III 22 676 0.74 0.55<br />
IV 41 753 0.44 0.30<br />
IV 44 664 0.36 0.27<br />
IV 42 689 0.39 0.28<br />
5.4 ABR OUTFLOW STREAM CHARACTERISTICS: PHASE II - IV<br />
The overall performance <strong>of</strong> the <strong>pilot</strong>-<strong>scale</strong> ABR under the conditions tested was assessed by<br />
examination <strong>of</strong> the outflow characteristics <strong>of</strong> the <strong>reactor</strong> in terms <strong>of</strong> COD, nutrients and solids<br />
concentration.<br />
5.4.1 COD<br />
Figure 5.8 shows the inflow and outflow COD concentrations measured during operation <strong>of</strong> the <strong>pilot</strong><strong>scale</strong><br />
ABR at Kingsburgh WWTP during the Phase II, II and IV. Red squares indicate weekly<br />
measurements <strong>of</strong> inflow COD made by the project team at the inlet to the <strong>pilot</strong>-<strong>scale</strong> ABR, while<br />
green circles (Phase III and IV) are similar measurements performed on a daily basis by the municipal<br />
staff at the head <strong>of</strong> works. ABR outflow samples were in some cases filtered through 0.45 µm acetate<br />
filters and analysed for COD as an indication <strong>of</strong> the amount <strong>of</strong> soluble COD present in the outflow.<br />
5.4.1.1 Phase II<br />
In Phase II, outflow COD values were around 300 mg/ℓ, with 20% to 50% <strong>of</strong> the measured COD<br />
being associated with suspended solids. The ABR consistently removed 500 to 600 mgCOD/ℓ except<br />
during the souring incident. The lowest outflow COD measurement was 125 mgCOD/ℓ. (A value <strong>of</strong><br />
64 mgCOD/ℓ measured on day 90 was ignored since this value was recorded on the first day after a<br />
lengthy period in which the <strong>reactor</strong> did not function at all, following electrical damage to the feeding<br />
system.)<br />
The souring incident on day 129 (Figure 5.8, Phase II) resulted in a large spike in the outlet COD<br />
concentration to 2 630 mgCOD/ℓ. Souring is a result <strong>of</strong> acidogenesis rate exceeding the rate <strong>of</strong><br />
methanogenesis; volatile fatty acids accumulate, thereby lowering the pH and inhibiting<br />
methanogenesis. If no methanogenesis occurs, no COD removal will occur, and outflow COD values<br />
will be high. It was observed that when sour, <strong>anaerobic</strong> sludge showed poor settling characteristics<br />
relative to normal operation, and consequently increased sludge washout was inferred from the black<br />
and turbid appearance <strong>of</strong> the outflow in this incident, further increasing the outflow COD value. Thus<br />
high outflow COD values were due to a combination <strong>of</strong> high VFA concentration and washed-out<br />
<strong>anaerobic</strong> sludge.<br />
93