analysis of a pilot-scale anaerobic baffled reactor treating domestic ...
analysis of a pilot-scale anaerobic baffled reactor treating domestic ...
analysis of a pilot-scale anaerobic baffled reactor treating domestic ...

Create successful ePaper yourself
Turn your PDF publications into a flip-book with our unique Google optimized e-Paper software.
efore this, there were two incidents that may have caused washout <strong>of</strong> sludge, on day 14 and day 36.<br />
these incidents resulted in reduction <strong>of</strong> the sludge bed volume and thus data before day 36 were not<br />
included in the regression.) The regression considers 53 days <strong>of</strong> stable operation from day 53 to day<br />
106. The regression was found to be significant (Table 5.3) and the sludge volume increased at a rate<br />
in the 95% confidence interval from 6.2 to 12.7 ℓ/d.<br />
In Phase III, there were few sludge washout incidents and there was a much less even distribution <strong>of</strong><br />
sludge between compartments (Figure 5.16 a). The average sludge bed height was more than double<br />
that observed in Phase II, and the highest sludge bed was usually observed in compartment 1.<br />
5.6.1.3 Phase IV: Solids levels<br />
In Phase IV, the flow rate and applied OLR were reduced. Operation was stable as a result <strong>of</strong><br />
improvements in the control algorithm, and few incidents <strong>of</strong> any kind were observed. There were no<br />
significant sludge washout incidents. The average height <strong>of</strong> the sludge beds (Figure 5.17 b) increased<br />
at a slower rate than in Phase III, and the shape <strong>of</strong> the pr<strong>of</strong>iles also changed, with higher settled sludge<br />
beds in the earlier compartments (Figure 5.17 a). Figure 5.17 (b) presents the calculated sludge<br />
volume in the upflow compartments <strong>of</strong> the <strong>pilot</strong>-<strong>scale</strong> ABR for Phase IV operation with a linear<br />
regression between time and sludge load. The linear regression was highly significant (Table 5.3) and<br />
the regressed slope <strong>of</strong> sludge volume accumulation was found to fall in the 95% confidence interval<br />
from 1.6 to 3.3 ℓ/d.<br />
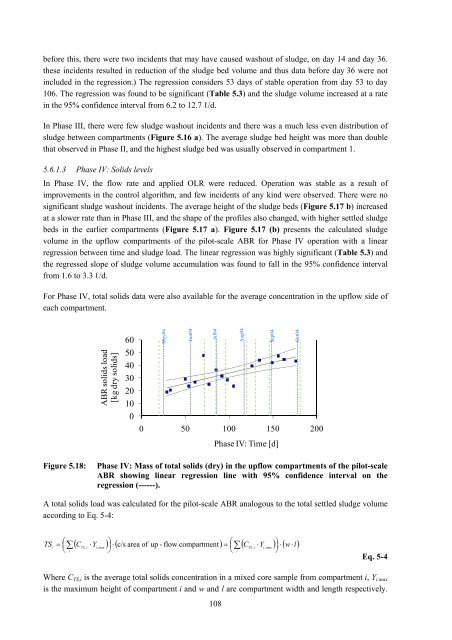
For Phase IV, total solids data were also available for the average concentration in the upflow side <strong>of</strong><br />
each compartment.<br />
ABR solids load<br />
[kg dry solids]<br />
60<br />
50<br />
40<br />
30<br />
20<br />
10<br />
0<br />
May04<br />
Jun04<br />
Jul04<br />
0 50 100 150 200<br />
Phase IV: Time [d]<br />
Figure 5.18: Phase IV: Mass <strong>of</strong> total solids (dry) in the upflow compartments <strong>of</strong> the <strong>pilot</strong>-<strong>scale</strong><br />
ABR showing linear regression line with 95% confidence interval on the<br />
regression (------).<br />
A total solids load was calculated for the <strong>pilot</strong>-<strong>scale</strong> ABR analogous to the total settled sludge volume<br />
according to Eq. 5-4:<br />
TS<br />
t<br />
( C ⋅Y<br />
) ⎞<br />
⋅ ( c/s<br />
area <strong>of</strong> up - flow compartment)<br />
=<br />
⎛ ( C ⋅Y<br />
) ⎞<br />
⋅ ( w ⋅ l)<br />
=<br />
⎛<br />
⎜<br />
∑<br />
⎝<br />
⎠<br />
⎝<br />
∑ TS , i i,<br />
max ⎟<br />
⎜ TS , i i,<br />
max<br />
i<br />
i<br />
108<br />
Eq. 5-4<br />
Where CTS,i is the average total solids concentration in a mixed core sample from compartment i, Yi,max<br />
is the maximum height <strong>of</strong> compartment i and w and l are compartment width and length respectively.<br />
Aug04<br />
Sep04<br />
⎟<br />
⎠<br />
Oct04<br />
0.1