analysis of a pilot-scale anaerobic baffled reactor treating domestic ...
analysis of a pilot-scale anaerobic baffled reactor treating domestic ...
analysis of a pilot-scale anaerobic baffled reactor treating domestic ...

Create successful ePaper yourself
Turn your PDF publications into a flip-book with our unique Google optimized e-Paper software.
Eq. 5-1<br />
However, at a COD/SO4 2- ratio <strong>of</strong> greater than 100:1, an average removal <strong>of</strong> 4 mgSO4 2- − 2−<br />
−<br />
−<br />
CH<br />
3COO<br />
+ SO4<br />
→ HS + 2HCO3<br />
/ℓ will not<br />
support a large sulphate reducing micro-organism population and the competition for COD substrate<br />
between sulphate reducing micro-organisms and methanogens would be negligible. The smell <strong>of</strong> H2S<br />
was never noticed around the <strong>pilot</strong>-<strong>scale</strong> ABR during any <strong>of</strong> the three phases <strong>of</strong> operation at<br />
Kingsburgh WWTP.<br />
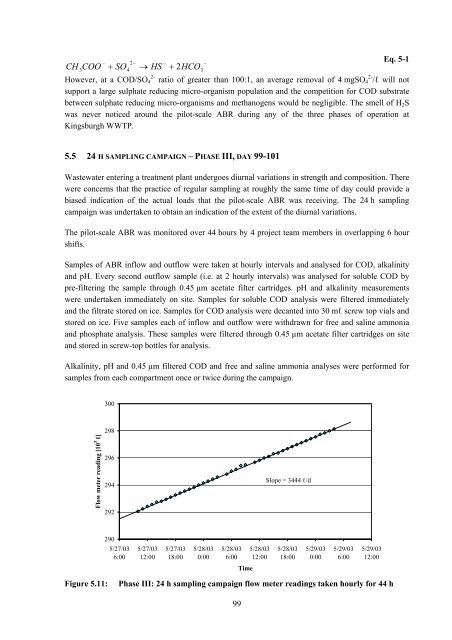
5.5 24 H SAMPLING CAMPAIGN – PHASE III, DAY 99-101<br />
Wastewater entering a treatment plant undergoes diurnal variations in strength and composition. There<br />
were concerns that the practice <strong>of</strong> regular sampling at roughly the same time <strong>of</strong> day could provide a<br />
biased indication <strong>of</strong> the actual loads that the <strong>pilot</strong>-<strong>scale</strong> ABR was receiving. The 24 h sampling<br />
campaign was undertaken to obtain an indication <strong>of</strong> the extent <strong>of</strong> the diurnal variations.<br />
The <strong>pilot</strong>-<strong>scale</strong> ABR was monitored over 44 hours by 4 project team members in overlapping 6 hour<br />
shifts.<br />
Samples <strong>of</strong> ABR inflow and outflow were taken at hourly intervals and analysed for COD, alkalinity<br />
and pH. Every second outflow sample (i.e. at 2 hourly intervals) was analysed for soluble COD by<br />
pre-filtering the sample through 0.45 µm acetate filter cartridges. pH and alkalinity measurements<br />
were undertaken immediately on site. Samples for soluble COD <strong>analysis</strong> were filtered immediately<br />
and the filtrate stored on ice. Samples for COD <strong>analysis</strong> were decanted into 30 mℓ screw top vials and<br />
stored on ice. Five samples each <strong>of</strong> inflow and outflow were withdrawn for free and saline ammonia<br />
and phosphate <strong>analysis</strong>. These samples were filtered through 0.45 µm acetate filter cartridges on site<br />
and stored in screw-top bottles for <strong>analysis</strong>.<br />
Alkalinity, pH and 0.45 µm filtered COD and free and saline ammonia analyses were performed for<br />
samples from each compartment once or twice during the campaign.<br />
Flow meter reading [10 3 ℓ]<br />
300<br />
298<br />
296<br />
294<br />
292<br />
290<br />
5/27/03<br />
6:00<br />
5/27/03<br />
12:00<br />
5/27/03<br />
18:00<br />
5/28/03<br />
0:00<br />
5/28/03<br />
6:00<br />
Figure 5.11: Phase III: 24 h sampling campaign flow meter readings taken hourly for 44 h<br />
99<br />
Time<br />
5/28/03<br />
12:00<br />
Slope = 3444 ℓ/d<br />
5/28/03<br />
18:00<br />
5/29/03<br />
0:00<br />
5/29/03<br />
6:00<br />
5/29/03<br />
12:00