analysis of a pilot-scale anaerobic baffled reactor treating domestic ...
analysis of a pilot-scale anaerobic baffled reactor treating domestic ...
analysis of a pilot-scale anaerobic baffled reactor treating domestic ...

Create successful ePaper yourself
Turn your PDF publications into a flip-book with our unique Google optimized e-Paper software.
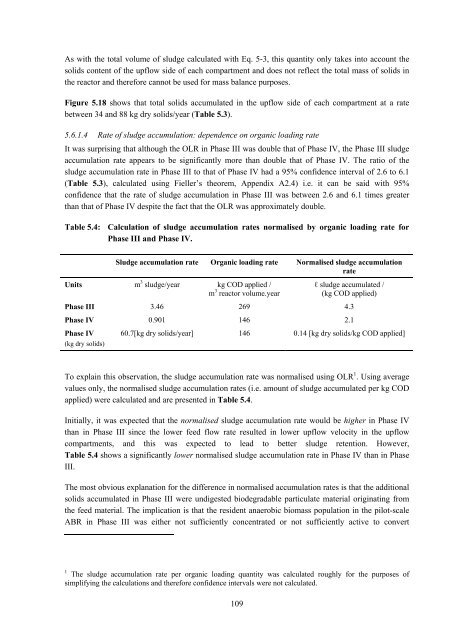
As with the total volume <strong>of</strong> sludge calculated with Eq. 5-3, this quantity only takes into account the<br />
solids content <strong>of</strong> the upflow side <strong>of</strong> each compartment and does not reflect the total mass <strong>of</strong> solids in<br />
the <strong>reactor</strong> and therefore cannot be used for mass balance purposes.<br />
Figure 5.18 shows that total solids accumulated in the upflow side <strong>of</strong> each compartment at a rate<br />
between 34 and 88 kg dry solids/year (Table 5.3).<br />
5.6.1.4 Rate <strong>of</strong> sludge accumulation: dependence on organic loading rate<br />
It was surprising that although the OLR in Phase III was double that <strong>of</strong> Phase IV, the Phase III sludge<br />
accumulation rate appears to be significantly more than double that <strong>of</strong> Phase IV. The ratio <strong>of</strong> the<br />
sludge accumulation rate in Phase III to that <strong>of</strong> Phase IV had a 95% confidence interval <strong>of</strong> 2.6 to 6.1<br />
(Table 5.3), calculated using Fieller’s theorem, Appendix A2.4) i.e. it can be said with 95%<br />
confidence that the rate <strong>of</strong> sludge accumulation in Phase III was between 2.6 and 6.1 times greater<br />
than that <strong>of</strong> Phase IV despite the fact that the OLR was approximately double.<br />
Table 5.4: Calculation <strong>of</strong> sludge accumulation rates normalised by organic loading rate for<br />
Phase III and Phase IV.<br />
Sludge accumulation rate Organic loading rate Normalised sludge accumulation<br />
rate<br />
Units m 3 sludge/year kg COD applied /<br />
m 3 <strong>reactor</strong> volume.year<br />
109<br />
ℓ sludge accumulated /<br />
(kg COD applied)<br />
Phase III 3.46 269 4.3<br />
Phase IV 0.901 146 2.1<br />
Phase IV<br />
(kg dry solids)<br />
60.7[kg dry solids/year] 146 0.14 [kg dry solids/kg COD applied]<br />
To explain this observation, the sludge accumulation rate was normalised using OLR 1 . Using average<br />
values only, the normalised sludge accumulation rates (i.e. amount <strong>of</strong> sludge accumulated per kg COD<br />
applied) were calculated and are presented in Table 5.4.<br />
Initially, it was expected that the normalised sludge accumulation rate would be higher in Phase IV<br />
than in Phase III since the lower feed flow rate resulted in lower upflow velocity in the upflow<br />
compartments, and this was expected to lead to better sludge retention. However,<br />
Table 5.4 shows a significantly lower normalised sludge accumulation rate in Phase IV than in Phase<br />
III.<br />
The most obvious explanation for the difference in normalised accumulation rates is that the additional<br />
solids accumulated in Phase III were undigested biodegradable particulate material originating from<br />
the feed material. The implication is that the resident <strong>anaerobic</strong> biomass population in the <strong>pilot</strong>-<strong>scale</strong><br />
ABR in Phase III was either not sufficiently concentrated or not sufficiently active to convert<br />
1 The sludge accumulation rate per organic loading quantity was calculated roughly for the purposes <strong>of</strong><br />
simplifying the calculations and therefore confidence intervals were not calculated.