analysis of a pilot-scale anaerobic baffled reactor treating domestic ...
analysis of a pilot-scale anaerobic baffled reactor treating domestic ...
analysis of a pilot-scale anaerobic baffled reactor treating domestic ...
You also want an ePaper? Increase the reach of your titles
YUMPU automatically turns print PDFs into web optimized ePapers that Google loves.
19 h apparent HRT 14 h apparent HRT<br />
n = 21 n = 16<br />
Alkalinity values Alkalinity values<br />
inflow sample time inflow outflow inflow sample time inflow outflow<br />
5/27/03 10:00 254.0032 299.3122 5/27/03 10:00 254.0032<br />
5/27/03 11:00 202.1441 5/27/03 11:00 202.1441<br />
5/27/03 12:00 185.905 280.0952 5/27/03 12:00 185.905<br />
5/27/03 13:00 173.9968 285.2678 5/27/03 13:00 173.9968<br />
5/27/03 14:00 171.2507 278.0478 5/27/03 14:00 171.2507<br />
5/27/03 15:00 169.1991 269.519 5/27/03 15:00 169.1991 299.3122<br />
5/27/03 16:00 162.359 266.4764 5/27/03 16:00 162.359<br />
5/27/03 17:00 254.2003 271.4025 5/27/03 17:00 254.2003 280.0952<br />
5/27/03 18:00 203.4527 5/27/03 18:00 203.4527 285.2678<br />
5/27/03 19:00 187.6578 249.3755 5/27/03 19:00 187.6578 278.0478<br />
5/27/03 20:00 181.7426 268.7387 5/27/03 20:00 181.7426 269.519<br />
5/27/03 21:00 179.8516 261.2244 5/27/03 21:00 179.8516 266.4764<br />
5/27/03 22:00 171.4792 272.247 5/27/03 22:00 171.4792 271.4025<br />
5/27/03 23:00 174.3711 275.0962 5/27/03 23:00 174.3711<br />
5/28/03 0:00 175.9694 276.4672 5/28/03 0:00 175.9694 249.3755<br />
5/28/03 1:00 173.6886 262.5183 5/28/03 1:00 173.6886 268.7387<br />
5/28/03 2:00 163.8433 275.574 5/28/03 2:00 163.8433 261.2244<br />
5/28/03 3:00 146.4356 265.2663 5/28/03 3:00 146.4356 272.247<br />
5/28/03 4:00 149.2014 276.5242 5/28/03 4:00 149.2014 275.0962<br />
5/28/03 5:00 164.3512 299.0592 5/28/03 5:00 164.3512 276.4672<br />
5/28/03 6:00 286.8892 5/28/03 6:00 262.5183<br />
5/28/03 7:00 208.4026 338.1573 5/28/03 7:00 208.4026 275.574<br />
5/28/03 8:00 293.6795 300.4317 5/28/03 8:00 293.6795 265.2663<br />
5/28/03 9:00 282.7434 286.2702 5/28/03 9:00 282.7434 276.5242<br />
299.0592<br />
286.8892<br />
338.1573<br />
300.4317<br />
286.2702<br />
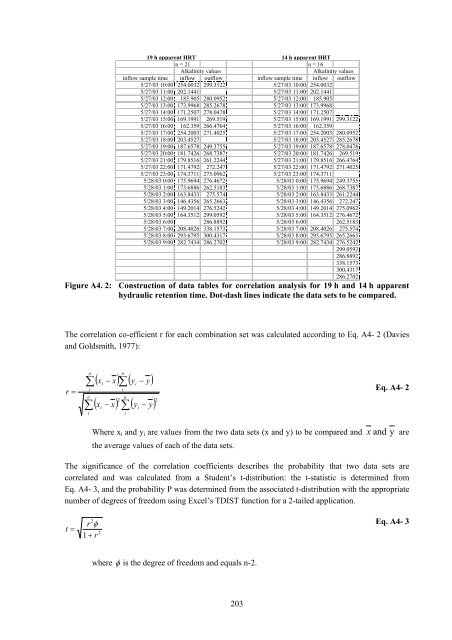
Figure A4. 2: Construction <strong>of</strong> data tables for correlation <strong>analysis</strong> for 19 h and 14 h apparent<br />
hydraulic retention time. Dot-dash lines indicate the data sets to be compared.<br />
The correlation co-efficient r for each combination set was calculated according to Eq. A4- 2 (Davies<br />
and Goldsmith, 1977):<br />
r =<br />
∑<br />
n<br />
∑<br />
i<br />
n<br />
i<br />
n<br />
( x − x)<br />
( y − y)<br />
∑<br />
n<br />
2<br />
( x − x)<br />
( y − y)<br />
i<br />
i<br />
i<br />
∑<br />
i<br />
i<br />
i<br />
2<br />
203<br />
Eq. A4- 2<br />
Where xi and yi are values from the two data sets (x and y) to be compared and x and y are<br />
the average values <strong>of</strong> each <strong>of</strong> the data sets.<br />
The significance <strong>of</strong> the correlation coefficients describes the probability that two data sets are<br />
correlated and was calculated from a Student’s t-distribution: the t-statistic is determined from<br />
Eq. A4- 3, and the probability P was determined from the associated t-distribution with the appropriate<br />
number <strong>of</strong> degrees <strong>of</strong> freedom using Excel’s TDIST function for a 2-tailed application.<br />
t =<br />
2<br />
r φ<br />
2<br />
1 + r<br />
where φ is the degree <strong>of</strong> freedom and equals n-2.<br />
Eq. A4- 3


