analysis of a pilot-scale anaerobic baffled reactor treating domestic ...
analysis of a pilot-scale anaerobic baffled reactor treating domestic ...
analysis of a pilot-scale anaerobic baffled reactor treating domestic ...

You also want an ePaper? Increase the reach of your titles
YUMPU automatically turns print PDFs into web optimized ePapers that Google loves.
with increasing hydraulic retention time. These authors found that hydraulic dead space was a function<br />
<strong>of</strong> number <strong>of</strong> baffles and flow rate, and that biological deadspace was related to biomass<br />
concentration, gas production rate and flow rate, but that there was no clear correlation between total<br />
dead space and hydraulic retention time.<br />
Nachaiyasit and Stuckey (1997c) also undertook residence time distribution studies on laboratory<strong>scale</strong><br />
ABRs and confirmed the value <strong>of</strong> 18% dead space for normal operation, and further found that<br />
increasing the amount <strong>of</strong> <strong>reactor</strong> biomass by three-fold did not affect the value <strong>of</strong> dead space<br />
calculated in the residence time distribution studies. Langenh<strong>of</strong>f (2000) undertook tracer tests to<br />
determine residence time distribution in 10 ℓ 8-compartment ABRs, fed synthetic low strength soluble<br />
and colloidal wastewater. No clear trends were observed in the residence time distribution with<br />
changes in hydraulic retention time, feed type or biomass concentration. In all tests, the dead space did<br />
not exceed 37 % <strong>of</strong> the total <strong>reactor</strong> volume. In Langenh<strong>of</strong>f’s study, no quantitative difference was<br />
observed in the amount <strong>of</strong> dead space determined from the tracer tests for identical <strong>reactor</strong>s with<br />
different amounts <strong>of</strong> biomass, confirming the findings <strong>of</strong> Nachaiyasit and Stuckey (1997c). It was also<br />
concluded that the mixing characteristics <strong>of</strong> the 8-compartment ABR could be simulated by 8<br />
continuous stirred tank <strong>reactor</strong>s (CSTRs) in series.<br />
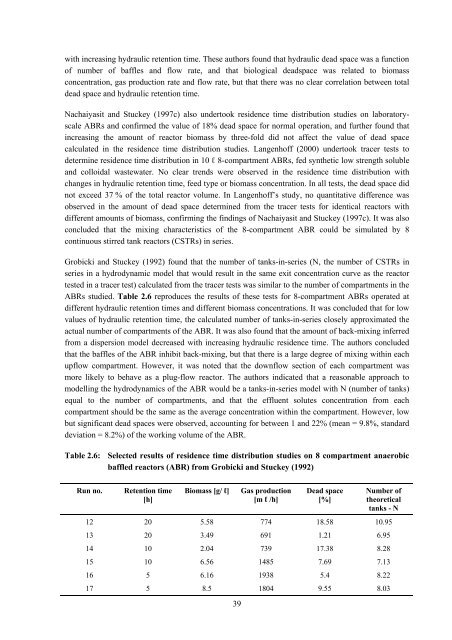
Grobicki and Stuckey (1992) found that the number <strong>of</strong> tanks-in-series (N, the number <strong>of</strong> CSTRs in<br />
series in a hydrodynamic model that would result in the same exit concentration curve as the <strong>reactor</strong><br />
tested in a tracer test) calculated from the tracer tests was similar to the number <strong>of</strong> compartments in the<br />
ABRs studied. Table 2.6 reproduces the results <strong>of</strong> these tests for 8-compartment ABRs operated at<br />
different hydraulic retention times and different biomass concentrations. It was concluded that for low<br />
values <strong>of</strong> hydraulic retention time, the calculated number <strong>of</strong> tanks-in-series closely approximated the<br />
actual number <strong>of</strong> compartments <strong>of</strong> the ABR. It was also found that the amount <strong>of</strong> back-mixing inferred<br />
from a dispersion model decreased with increasing hydraulic residence time. The authors concluded<br />
that the baffles <strong>of</strong> the ABR inhibit back-mixing, but that there is a large degree <strong>of</strong> mixing within each<br />
upflow compartment. However, it was noted that the downflow section <strong>of</strong> each compartment was<br />
more likely to behave as a plug-flow <strong>reactor</strong>. The authors indicated that a reasonable approach to<br />
modelling the hydrodynamics <strong>of</strong> the ABR would be a tanks-in-series model with N (number <strong>of</strong> tanks)<br />
equal to the number <strong>of</strong> compartments, and that the effluent solutes concentration from each<br />
compartment should be the same as the average concentration within the compartment. However, low<br />
but significant dead spaces were observed, accounting for between 1 and 22% (mean = 9.8%, standard<br />
deviation = 8.2%) <strong>of</strong> the working volume <strong>of</strong> the ABR.<br />
Table 2.6: Selected results <strong>of</strong> residence time distribution studies on 8 compartment <strong>anaerobic</strong><br />
<strong>baffled</strong> <strong>reactor</strong>s (ABR) from Grobicki and Stuckey (1992)<br />
Run no. Retention time<br />
[h]<br />
Biomass [g/ ℓ] Gas production<br />
[m ℓ /h]<br />
39<br />
Dead space<br />
[%]<br />
Number <strong>of</strong><br />
theoretical<br />
tanks - N<br />
12 20 5.58 774 18.58 10.95<br />
13 20 3.49 691 1.21 6.95<br />
14 10 2.04 739 17.38 8.28<br />
15 10 6.56 1485 7.69 7.13<br />
16 5 6.16 1938 5.4 8.22<br />
17 5 8.5 1804 9.55 8.03