analysis of a pilot-scale anaerobic baffled reactor treating domestic ...
analysis of a pilot-scale anaerobic baffled reactor treating domestic ...
analysis of a pilot-scale anaerobic baffled reactor treating domestic ...

You also want an ePaper? Increase the reach of your titles
YUMPU automatically turns print PDFs into web optimized ePapers that Google loves.
A filter for converting feed SBCOD composition from the carbohydrate-lipid-protein characterisation<br />
to the elemental composition (CXHYOZNA) is presented in Appendix A6.2.<br />
The wastewater characterisation presented in Table 6.3 represents an average composition <strong>of</strong><br />
Kingsburgh WWTP and was used as a base case for investigation <strong>of</strong> effluent characteristics using the<br />
steady-state model.<br />
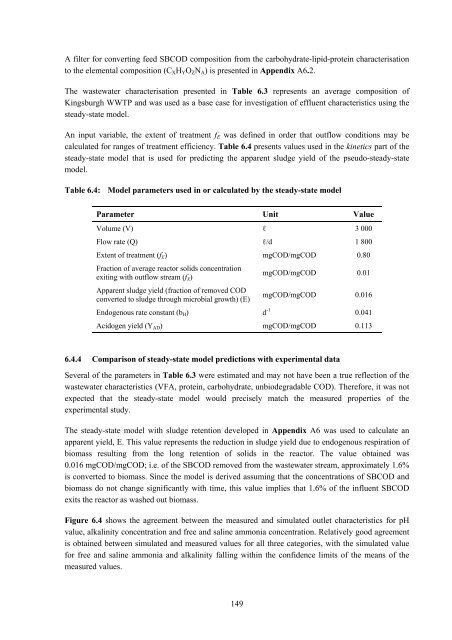
An input variable, the extent <strong>of</strong> treatment fE was defined in order that outflow conditions may be<br />
calculated for ranges <strong>of</strong> treatment efficiency. Table 6.4 presents values used in the kinetics part <strong>of</strong> the<br />
steady-state model that is used for predicting the apparent sludge yield <strong>of</strong> the pseudo-steady-state<br />
model.<br />
Table 6.4: Model parameters used in or calculated by the steady-state model<br />
Parameter Unit Value<br />
Volume (V) ℓ 3 000<br />
Flow rate (Q) ℓ/d 1 800<br />
Extent <strong>of</strong> treatment (fE) mgCOD/mgCOD 0.80<br />
Fraction <strong>of</strong> average <strong>reactor</strong> solids concentration<br />
exiting with outflow stream (fX)<br />
mgCOD/mgCOD 0.01<br />
Apparent sludge yield (fraction <strong>of</strong> removed COD<br />
converted to sludge through microbial growth) (E)<br />
mgCOD/mgCOD 0.016<br />
Endogenous rate constant (bH) d -1 0.041<br />
Acidogen yield (YAD) mgCOD/mgCOD 0.113<br />
6.4.4 Comparison <strong>of</strong> steady-state model predictions with experimental data<br />
Several <strong>of</strong> the parameters in Table 6.3 were estimated and may not have been a true reflection <strong>of</strong> the<br />
wastewater characteristics (VFA, protein, carbohydrate, unbiodegradable COD). Therefore, it was not<br />
expected that the steady-state model would precisely match the measured properties <strong>of</strong> the<br />
experimental study.<br />
The steady-state model with sludge retention developed in Appendix A6 was used to calculate an<br />
apparent yield, E. This value represents the reduction in sludge yield due to endogenous respiration <strong>of</strong><br />
biomass resulting from the long retention <strong>of</strong> solids in the <strong>reactor</strong>. The value obtained was<br />
0.016 mgCOD/mgCOD; i.e. <strong>of</strong> the SBCOD removed from the wastewater stream, approximately 1.6%<br />
is converted to biomass. Since the model is derived assuming that the concentrations <strong>of</strong> SBCOD and<br />
biomass do not change significantly with time, this value implies that 1.6% <strong>of</strong> the influent SBCOD<br />
exits the <strong>reactor</strong> as washed out biomass.<br />
Figure 6.4 shows the agreement between the measured and simulated outlet characteristics for pH<br />
value, alkalinity concentration and free and saline ammonia concentration. Relatively good agreement<br />
is obtained between simulated and measured values for all three categories, with the simulated value<br />
for free and saline ammonia and alkalinity falling within the confidence limits <strong>of</strong> the means <strong>of</strong> the<br />
measured values.<br />
149